Allstate Boston Consulting Group Matrix
Fully Editable
Tailor To Your Needs In Excel Or Sheets
Professional Design
Trusted, Industry-Standard Templates
Pre-Built
For Quick And Efficient Use
No Expertise Is Needed
Easy To Follow
Allstate Bundle
What is included in the product
Strategic Allstate portfolio analysis via BCG Matrix.
Instantly view and share Allstate business units with a single, easy-to-understand quadrant overview.
What You See Is What You Get
Allstate BCG Matrix
The Allstate BCG Matrix preview mirrors the purchase: a complete, ready-to-use document. Download the unedited report, formulated by experts, for strategic business application. Expect the same, professional file – no surprises. Instant access after checkout allows immediate analysis and action.

BCG Matrix Template
See the Bigger Picture
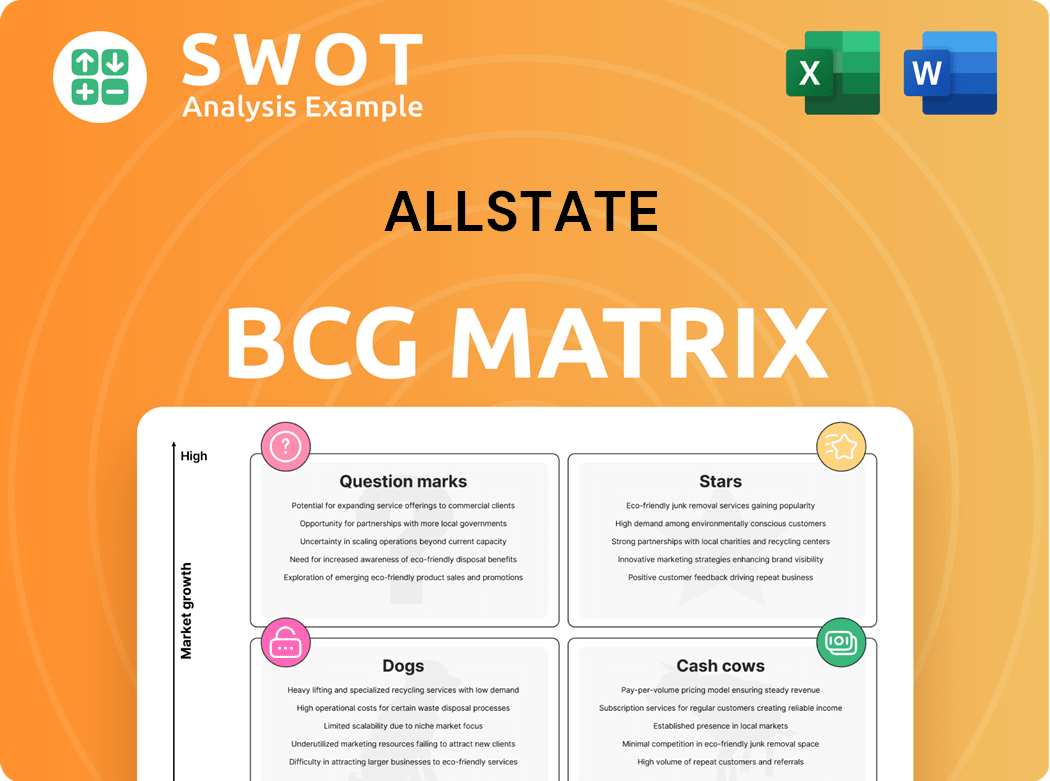
Allstate's BCG Matrix offers a strategic snapshot of its diverse offerings. Discover how its products rank within the Stars, Cash Cows, Dogs, and Question Marks categories. Understand their market share and growth rate dynamics. This preview is just a taste of the deeper analysis available.
Get the full BCG Matrix report to unlock comprehensive quadrant placements and actionable strategic recommendations. It's your key to informed investment and product planning decisions.
Stars
Strong Financial Performance in 2024
Allstate's financial prowess shone in 2024. Total revenue surged by 12.3%, hitting $64.1 billion, a testament to its strong market position. Net income bounced back to $4.6 billion, reversing 2023's losses. The adjusted net income return on equity hit an impressive 26.8%, highlighting effective equity management.
Transformative Growth Initiatives
Allstate's transformative growth strategy, launched in 2020, aims to boost customer value with accessible products. Allstate has improved its competitive price position. The adjusted expense ratio dropped from 27.9 in 2019 to 23.1 in 2024. New insurance products and app redesigns highlight their innovation.

Growth in Property-Liability Policies
Allstate aims to boost its property-liability policies by retaining customers and securing new sales. In 2024, homeowners policies rose about 2.5%, fueled by high retention and new business. Allstate is rolling out affordable products and investing in marketing for future growth. This strategy is part of Allstate's effort to expand its insurance offerings.
Strategic Investments and Acquisitions
Allstate's strategic investments significantly boosted its financial performance. Their shift to higher-yielding fixed income, coupled with portfolio growth, resulted in a 24.8% surge in net investment income, reaching $3.1 billion by the end of 2024. This financial strength was also reinforced by the diversified investment portfolio that included public equities and private investments, providing steady returns amidst market volatility. The acquisition of National General expanded Allstate's reach, supporting growth in personal lines policies.
- 24.8% increase in net investment income.
- $3.1 billion net investment income in 2024.
- Diversified portfolio with public and private investments.
- Acquisition of National General expanded distribution.
Digital Transformation and Innovation
Allstate is aggressively pursuing digital transformation and innovation, using technology to improve customer experiences and operational efficiency. The company's focus includes machine learning and artificial intelligence, driving significant changes. Allstate's mobile app enhancements, such as a gas finder and data breach checker, have been highly successful. This digital-first approach has earned Allstate recognition and improved its standing in the industry.
- Allstate's mobile app ranked second in Corporate Insight's 2024 P&C Insurance Experience Benchmark.
- Allstate's investments in digital capabilities have resulted in a 15% increase in online policy management.
- Over 70% of Allstate's customer interactions are now digital.
- Allstate aims to reduce operational costs by 10% through AI and automation by 2026.
Allstate's Stellar Performance: Revenue Soars!
Allstate is a "Star" in the BCG Matrix due to its strong market position and rapid growth. The company's revenue grew by 12.3% in 2024, reaching $64.1 billion. Allstate's innovative approach and strategic investments also fuel its success.
| Metric | 2024 Data |
|---|---|
| Revenue Growth | 12.3% |
| Total Revenue | $64.1 billion |
| Net Investment Income Increase | 24.8% |
Cash Cows
Established Market Presence
Allstate is a Cash Cow, boasting a solid market presence. It holds a 10.4% share in U.S. personal auto and 8.9% in homeowners insurance markets. This strong position, backed by a recognizable brand and large customer base, drives consistent revenue. Allstate's diverse distribution network ensures wide market reach.
Auto Insurance Profitability
Allstate's auto insurance is a cash cow. In 2024, it achieved an underwriting profit of $1.8 billion, a significant improvement from a $1.1 billion loss the previous year. The combined ratio improved, reaching 93.5 in Q4 2024 and 95.0 for the full year. This segment's profitability allows Allstate to pursue growth.

Homeowners Insurance Performance
Allstate's homeowners insurance is a cash cow, delivering solid returns. It achieved an underwriting profit in Q3 2024, even with $1.2B in catastrophe losses. The combined ratio was 90.1 in 2024, yielding a $1.3B underwriting profit. Growth is driven by strong policy retention and new business.
Capital Management and Shareholder Returns
Allstate's dedication to shareholders is evident through its robust capital management strategy. In 2024, the company showed its financial strength by authorizing a $1.5 billion share repurchase program and raising its dividend by 8.7%. Allstate's commitment to returning value is further demonstrated by the $1.1 billion in dividends paid out during the year. The company's available capital of $21.9 billion offers flexibility for strategic investments.
- Share Repurchase Program: $1.5 billion authorized.
- Dividend Increase: 8.7% increase.
- Dividends Paid in 2024: $1.1 billion.
- Total Available Capital: $21.9 billion.
Protection Services Revenue
Allstate's Protection Services, encompassing Allstate Protection Plans and Arity, is a key cash cow. This segment significantly boosts Allstate's financial health, with revenue hitting $889 million in Q4 2024, a 23.6% increase year-over-year. The segment's expansion in both domestic and global markets fuels this growth. The number of Allstate Protection Plans policies has surged, indicating strong potential.
- Q4 2024 Protection Services revenue: $889 million
- Year-over-year revenue growth: 23.6%
- Allstate Protection Plans policies since 2019: Up 60%
- Total Allstate Protection Plans policies: 160 million
Financial Highlights: Auto, Homeowners, and Protection Services
Allstate's cash cows, auto, and homeowners insurance, along with protection services, consistently generate substantial revenue. Auto insurance saw a $1.8B underwriting profit in 2024. Homeowners insurance had a 90.1 combined ratio in 2024. Protection Services revenue rose to $889M in Q4 2024.
| Segment | 2024 Underwriting Profit | Q4 2024 Revenue |
|---|---|---|
| Auto Insurance | $1.8 Billion | - |
| Homeowners Insurance | $1.3 Billion | - |
| Protection Services | - | $889 Million |
Dogs
California Homeowners Insurance Market
Allstate is carefully managing its California homeowners insurance. The company experienced substantial wildfire-related losses. They reported about $2 billion in gross losses during Q4 2024. However, net losses were reduced to $1.1 billion due to reinsurance. Allstate is waiting for market improvements before expanding.
Individual Health Business
Allstate divested its Individual Health business. This strategic move, completed in 2024, generated $3.25 billion. The sale of Health & Benefits businesses is expected to produce a $1.0 billion gain in 2025. It shifted focus towards core areas.

Allstate Roadside Services
Allstate Roadside Services saw an 18.2% revenue decrease in Q4 2024. This drop, due to exiting an unprofitable customer, hints at service line issues. Despite improved net income, revenue decline signals needed strategic changes for profitability. Allstate should boost efficiency and customer acquisition to prevent performance drags.
Esurance Brand
Allstate's decision to retire Esurance highlights its struggles in the direct insurance market. The brand was slated for retirement, reflecting unmet expectations and the need for strategic realignment. Esurance's performance likely underperformed, prompting Allstate to shift focus to other distribution strategies. This move underscores the challenges faced in the competitive direct-to-consumer insurance space.
- In 2023, Allstate reported a net loss of $1.3 billion, impacted by underwriting losses, which could have influenced the decision to restructure Esurance.
- The direct-to-consumer insurance market is highly competitive, with established players like GEICO and Progressive.
- Allstate's strategic shift might involve focusing on its core brand and agency distribution.
Retention Pressures
Allstate's "Dogs" quadrant, particularly in New York and New Jersey, struggles with retention. Rate hikes, crucial for profitability, drive customers away. Retention has improved elsewhere, but more adjustments are needed in these key states, potentially hurting policy counts. Allstate must offer discounts and tailored coverage to improve affordability and keep customers.
- 2024: Allstate's Q1 results showed a 5.8% decrease in policies in force.
- New York and New Jersey rate increases are ongoing to address profitability issues.
- Customer retention is a key focus to mitigate policy count declines.
- Allstate aims to balance profitability with customer affordability.
NY/NJ Insurance Woes: Retention and Rate Hikes
Allstate's "Dogs" include NY and NJ, suffering retention issues and declining policy counts. Rate hikes aimed at improving profitability drive customers away. This strategy impacts overall performance, requiring adjustments. Allstate needs tailored solutions to stay competitive.
| Metric | Details | Impact |
|---|---|---|
| Policy Count Decline | Q1 2024: 5.8% decrease | Reduced revenue |
| Rate Increases | Ongoing in NY/NJ | Customer churn |
| Retention Focus | Key strategic initiative | Improve profitability |
Question Marks
Connected Auto and Homeowners Insurance
Allstate's connected auto and homeowners insurance, though launched in select states, is a question mark due to high uncertainty. Success hinges on consumer uptake and proving value through data. Allstate must invest in marketing. In 2024, connected insurance premiums are expected to reach $10 billion.
Affordable Auto and Homeowners Products
Allstate's affordable insurance targets price-conscious customers. Success hinges on profitability and customer happiness. These products could be stars or dogs. In 2024, Allstate's auto insurance premiums rose, reflecting strategic shifts.

Arity Data and Analytics
Arity, Allstate's data analytics arm, aims for revenue growth via lead sales and data services. In Q4 2024, Arity's revenue increased, but the adjusted net loss persisted. Allstate must invest in Arity to improve profitability. For 2024, Allstate's total revenue reached approximately $15.8 billion.
Expansion in Independent Agent Channel
Allstate's move to expand its independent agent channel, especially after acquiring National General, is a significant strategic shift. This channel provides access to a wider customer base, potentially boosting market reach. However, it demands strong management of agent relations and careful navigation of potential conflicts. Success hinges on seamlessly integrating National General and leveraging the independent agent network for profitable growth.
- National General acquisition expanded Allstate's independent agent network significantly.
- Independent agents often have established local market knowledge.
- Integration challenges can impact the overall financial performance.
- Allstate's Q3 2023 results showed a focus on this channel.
Electric Vehicle and AI Integration
Allstate faces significant shifts with EVs and AI integration, fitting into its BCG Matrix. The rise of EVs could reshape auto insurance demand, urging Allstate to create EV-specific insurance products. AI's role in claims processing is crucial, affecting customer service and operational efficiency. Successfully navigating these changes is vital for Allstate's market position.
- EV sales are projected to reach 14.4 million units in 2024, marking a 25% increase from 2023.
- Allstate has invested heavily in AI, with over $500 million allocated to technology and digital transformation initiatives in 2023.
- The average claim processing time using AI has decreased by 30% compared to traditional methods.
- Allstate's market share in the auto insurance sector stood at approximately 9% in 2024.
Strategic Shifts: Navigating Uncertainty
Allstate's question marks face high uncertainty and require strategic investment. Connected auto insurance needs consumer adoption and proof of value. Arity, though showing revenue growth, still struggles with profitability. The independent agent channel expansion presents both opportunities and risks.
| Aspect | Details | 2024 Data |
|---|---|---|
| Connected Insurance | Requires consumer uptake, proving value. | Premiums expected to reach $10B. |
| Arity | Focus on revenue growth via data services. | Q4 revenue increase, adjusted net loss persists. |
| Independent Agent | Expanded channel, access to a wider customer base. | Strategic shift post-National General acquisition. |
BCG Matrix Data Sources
The Allstate BCG Matrix relies on financial statements, market analysis, industry reports, and expert opinions for robust and reliable assessments.
