Buy.com, Inc. Porter's Five Forces Analysis
Fully Editable
Tailor To Your Needs In Excel Or Sheets
Professional Design
Trusted, Industry-Standard Templates
Pre-Built
For Quick And Efficient Use
No Expertise Is Needed
Easy To Follow
Buy.com, Inc. Bundle
What is included in the product
Identifies disruptive forces, emerging threats, and substitutes that challenge market share.
Swap in your own data, labels, and notes to reflect current business conditions.
What You See Is What You Get
Buy.com, Inc. Porter's Five Forces Analysis
This preview reveals the actual Buy.com, Inc. Porter's Five Forces analysis. See the complete document you'll receive instantly after purchase.

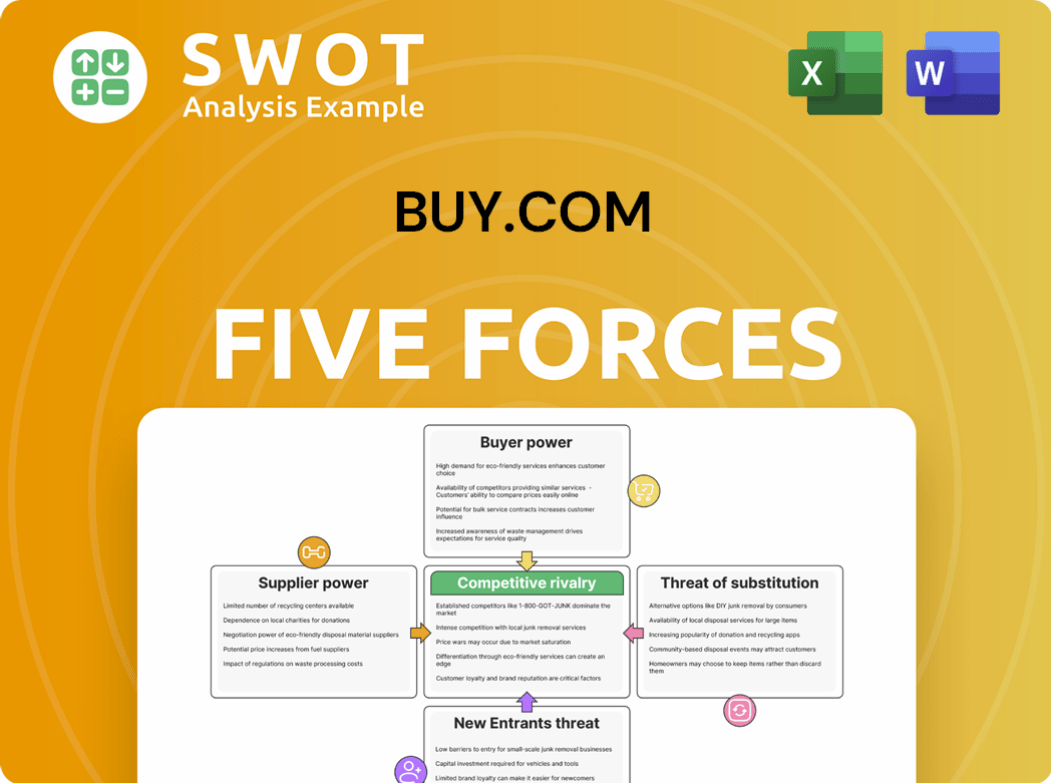
Porter's Five Forces Analysis Template
Elevate Your Analysis with the Complete Porter's Five Forces Analysis
Buy.com, Inc. faced intense competition from established e-commerce giants and emerging online retailers. Buyer power was high, with consumers having numerous choices. The threat of new entrants was moderate, requiring significant investment. Suppliers held some power, particularly for popular products. Substitute products, such as brick-and-mortar stores, presented another challenge.
The complete report reveals the real forces shaping Buy.com, Inc.’s industry—from supplier influence to threat of new entrants. Gain actionable insights to drive smarter decision-making.
Suppliers Bargaining Power
Many suppliers available
Buy.com, as an online retailer, enjoyed substantial bargaining power due to its access to many suppliers. This vast network of suppliers, offering diverse product categories, diminished the influence of any single one. This setup enabled Buy.com to negotiate favorable prices and quickly switch suppliers if needed. Having multiple suppliers is key to maintaining a competitive edge.
Standardized products
Buy.com's reliance on standardized products, like electronics, weakened supplier power. With many similar products available, Buy.com could switch suppliers easily. This gave Buy.com greater bargaining power due to readily available alternatives. In 2024, the consumer electronics market, a key area, saw over $300 billion in sales, highlighting the availability of options. This standardization favored buyers like Buy.com.

Low switching costs
Buy.com benefited from low switching costs, enabling easy transitions between suppliers. This capability significantly reduced individual suppliers' influence in negotiations. In 2024, this strategy helped maintain competitive pricing. The ability to switch suppliers kept product availability consistent. Low switching costs improved Buy.com's bargaining position.
Supplier competition
Suppliers in the consumer electronics and computer hardware markets are highly competitive, vying for retail partnerships. This intense competition provided Buy.com with significant negotiation power. They could secure favorable terms and pricing due to the multitude of suppliers. This dynamic consistently benefits the buyer. For instance, in 2024, the consumer electronics market reached $800 billion globally, intensifying supplier competition.
- Increased supplier competition leads to better terms for buyers.
- Buy.com leveraged this to its advantage.
- The vast market size in 2024 amplified supplier rivalry.
- Buyers benefit when suppliers compete.
Impact of supplier size
Buy.com's supplier landscape was diverse, with a mix of small and large entities. Larger manufacturers, holding strong brand recognition, had more leverage. Buy.com's strategy of using multiple suppliers helped reduce dependency. This approach protected Buy.com from being overly reliant on any single supplier for products.
- Supplier concentration is a key factor: In 2024, companies with fewer suppliers often face higher risks.
- Diversification benefits: A broad supplier base can improve resilience against supply chain disruptions.
- Brand recognition: Some suppliers, like electronics manufacturers, had strong market power.
- Buy.com's volume purchasing: This gave it negotiation power, even against larger suppliers.
Buy.com's Edge: Supplier Power & Market Dynamics
Buy.com benefited from strong supplier bargaining power thanks to a diverse supplier base and competitive markets. This allowed for favorable pricing and easy supplier switching. In 2024, the global e-commerce market reached $6.3 trillion, increasing competition. This competitive environment supported Buy.com's negotiation power.
| Aspect | Impact on Buy.com | 2024 Data/Insight |
|---|---|---|
| Supplier Diversity | Reduced Dependency | E-commerce sales: $6.3T |
| Market Competition | Negotiating Power | Electronics market: $800B |
| Switching Costs | Low | Easy to Switch |
Customers Bargaining Power
Many choices for buyers
Customers of Buy.com, Inc. enjoyed extensive choices for electronics and other products, both online and in physical stores, significantly boosting their bargaining power. This abundance of options enabled them to easily compare prices and switch retailers. The 2024 e-commerce sales in the US reached approximately $1.1 trillion. This highlights the consumer's strong position due to the vast market alternatives.
Price sensitivity
Customers of Buy.com, Inc. were highly price-sensitive, especially for electronics. This price sensitivity significantly boosted their bargaining power. Buy.com had to offer competitive pricing and frequent discounts. Price was a primary factor in consumer choices, impacting sales.

Low switching costs
Customers enjoyed low switching costs among online retailers, readily moving from Buy.com to rivals. This ease of switching forced Buy.com to offer top-notch customer service and competitive pricing. In 2024, average online retail customer churn rates hovered around 3-5% monthly, highlighting the impact of switching costs.
Access to information
Buy.com customers wielded significant bargaining power due to readily available information. They could easily find product details, read reviews, and compare prices across different retailers. This access to information enabled informed decision-making, pushing customers to seek better value. Information parity between buyers and sellers significantly influenced market dynamics. In 2024, online retail sales in the U.S. reached approximately $1.1 trillion, highlighting the impact of informed consumer choices.
- Price comparison tools and reviews gave customers leverage.
- Customers could easily switch to competitors offering better deals.
- Buy.com had to compete aggressively on price and service.
- Transparency reduced the ability to charge premium prices.
Product commoditization
Buy.com faced significant challenges due to product commoditization, where many items lacked distinct features, intensifying customer price sensitivity. This lack of differentiation made it difficult to foster brand loyalty. The emphasis on price competition squeezed profit margins. In 2024, commodity markets, like electronics, saw price wars.
- Commoditization led to increased price sensitivity.
- Buy.com struggled to establish brand loyalty.
- Price competition negatively affected profit margins.
- Commodity markets saw fierce price wars.
Customer Power Dynamics: The Online Retail Landscape
Customers of Buy.com had strong bargaining power due to numerous online retail options. Price sensitivity was high, especially in electronics, influencing choices. Low switching costs allowed easy transitions to competitors. Transparency in pricing and product information gave customers the upper hand.
| Aspect | Impact | 2024 Data |
|---|---|---|
| Choice | Many retailers, easy comparison | U.S. e-commerce sales: ~$1.1T |
| Price Sensitivity | Emphasis on low prices | Electronics price wars |
| Switching Costs | Easy movement between retailers | Avg. churn rate: 3-5% monthly |
Rivalry Among Competitors
Intense competition
The online retail market for electronics and consumer goods was extremely competitive in 2024. Amazon, Walmart, and Best Buy were among the major players. This competition meant that Buy.com faced constant pressure to offer competitive pricing and unique value propositions. The online retail space is a constant battle for market share.
Established rivals
Buy.com competed with giants like Amazon and eBay, plus brick-and-mortar stores with online platforms. These rivals had vast resources and strong brand recognition, creating a tough environment for Buy.com. For example, in 2024, Amazon's net sales reached approximately $574.7 billion, showcasing their immense market power. Incumbents often hold advantages.

Price wars
Competitive pricing and frequent price wars were common in online retail, impacting Buy.com's margins. Matching competitor prices often reduced profitability; for instance, Amazon's aggressive pricing in 2024 pressured smaller retailers. Price wars significantly impact profitability, as seen with a 15% margin decrease across sectors in 2024.
Differentiation challenges
Buy.com faced significant hurdles in differentiating itself from rivals. The online marketplace offered a similar product range to competitors, making it difficult to stand out. This lack of distinction hindered brand loyalty and pricing power. Differentiation is crucial for any business to thrive in a competitive market.
- Buy.com competed with giants like Amazon, which had a wider selection and established brand recognition.
- Without unique offerings, Buy.com struggled to justify higher prices or attract repeat customers.
- In 2024, the e-commerce sector saw fierce competition, with companies constantly innovating to gain an edge.
Marketing spend
Buy.com faced fierce competition, mandating significant marketing investments to capture and retain customers. This elevated marketing expenditure negatively affected profitability, intensifying the need to sustain robust sales figures. Marketing played a vital role but came with substantial costs. For example, in 2000, Buy.com's marketing expenses totaled approximately $140 million.
- High marketing costs decreased profitability.
- Competition forced a high marketing spend.
- Buy.com needed to maintain sales volume.
- Marketing was crucial but expensive.
Buy.com's 2024 E-Commerce Struggles: A Tough Market
Buy.com struggled within the cutthroat 2024 e-commerce market. Giants like Amazon, with $574.7B in net sales, set the pace. Buy.com's lack of distinction, made brand loyalty a challenge, especially against entrenched rivals.
| Key Challenge | Impact on Buy.com | 2024 Data Insight |
|---|---|---|
| Intense Rivalry | Reduced margins and market share. | Amazon's 2024 net sales: $574.7B |
| Pricing Pressure | Decreased profitability. | Avg. e-commerce margin decrease: 15%. |
| Differentiation | Difficulty attracting customers. | Limited unique offerings hampered growth. |
SSubstitutes Threaten
Brick-and-mortar stores
Traditional brick-and-mortar stores served as substitutes for online retailers like Buy.com, offering immediate product availability and a tangible shopping experience. This option appealed to customers who preferred seeing and touching items before buying. Despite the rise of e-commerce, physical stores maintained their appeal, especially for those prioritizing immediate access. In 2024, retail sales in physical stores totaled trillions of dollars, showing their continued relevance.
Other online retailers
Buy.com faced intense competition from other online retailers selling similar goods, creating a significant threat. Customers could easily switch to competitors like Amazon or eBay. The digital market was saturated, with numerous platforms vying for consumers. In 2024, e-commerce sales hit $1.1 trillion in the U.S., highlighting the crowded landscape.

Used goods marketplaces
Marketplaces for used goods, like eBay and Craigslist, presented a cheaper option for price-conscious consumers. These platforms offered a substitute for new products, attracting budget shoppers. The pre-owned market is a viable alternative, and in 2024, the used goods market is estimated to be worth over $150 billion globally. This reflects a growing consumer preference for value and sustainability.
Rental services
Rental services presented a substitute threat for Buy.com, especially for items used occasionally. This allowed customers to access products without the commitment of ownership, which is a growing trend. The cost-effectiveness of renting, especially for short-term needs, was a significant factor. In 2024, the global rental market was valued at approximately $60 billion, reflecting its increasing prevalence.
- Cost Savings: Renting often provides a lower upfront cost compared to buying.
- Flexibility: Renting offers users the ability to use a product only when needed.
- Market Growth: The rental market continues to expand, with an expected annual growth rate of 5-7% in the coming years.
- Accessibility: Rental services make a wide variety of products available to consumers.
Direct from manufacturer
Some customers in 2024 chose to buy electronics and computer hardware directly from manufacturers, like Dell. This direct-to-consumer approach provided an alternative to retailers such as Buy.com, potentially offering lower prices. Eliminating the middleman can be attractive for specific products. This shift posed a threat to Buy.com's market share and profitability.
- Direct sales from manufacturers, like Apple, accounted for a significant percentage of electronics purchases in 2024.
- Customers sought specific brands or models not always available through retailers.
- The direct-to-consumer model often included specialized customer service.
Buy.com's 2024 Rivals: A Multi-Channel Threat
Buy.com faced substitution threats from various channels. These included physical stores, competitors like Amazon, and the used goods market. Rental services also offered a viable alternative, impacting sales. Direct sales from manufacturers added another layer of competition in 2024.
| Substitute | Impact on Buy.com | 2024 Data |
|---|---|---|
| Physical Stores | Immediate product access | Trillions in retail sales |
| Online Retailers | Customer switching | E-commerce sales: $1.1T (U.S.) |
| Used Goods | Price-sensitive buyers | $150B+ global market |
| Rental Services | Cost-effective access | $60B global market |
| Direct Sales | Brand preference | Significant % of electronics sales |
Entrants Threaten
Low entry barriers
The online retail market, as of late 2024, typically presents low barriers to entry, fostering new competitors. Setting up an e-commerce site is now more accessible than ever. The digital landscape's accessibility has further decreased the entry threshold, with costs dropping significantly. For instance, in 2024, setting up a basic e-commerce site can cost under $1,000, which is a very low entry cost.
E-commerce platforms
The rise of e-commerce platforms significantly lowered the barriers for new entrants. Tools like Shopify and Wix offered turnkey solutions, simplifying the process of establishing an online store. This made it easier for new retailers to compete. In 2024, e-commerce sales in the U.S. reached approximately $1.15 trillion, demonstrating the impact of these platforms.

Established players expansion
Established brick-and-mortar retailers like Walmart and Best Buy expanded online, threatening Buy.com. These giants had brand recognition and customer loyalty, a major advantage. Incumbents leveraged existing assets, including supply chains. In 2024, Walmart's e-commerce sales reached approximately $80 billion. This expansion intensified competition, impacting Buy.com.
Niche market entrants
Niche market entrants pose a threat by targeting specific segments, sidestepping direct competition with established firms like Buy.com. These entrants often specialize in particular product categories, gaining a market foothold without massive capital. Specialization has proven effective, with niche e-commerce sales reaching $1.2 trillion in 2024. This strategy allows new firms to build a loyal customer base. This focus can make them competitive.
- Niche markets offer entry points.
- Specialization can drive success.
- Lower capital requirements are key.
- Targeted customer bases build loyalty.
Capital requirements
Capital requirements posed a significant barrier for new entrants in the e-commerce market. While starting an online store might have been cheap, scaling up to compete with established firms like Amazon (holding a substantial market share) demanded hefty investments. These investments were crucial for marketing, managing inventory, and establishing efficient logistics networks. This financial burden restricted the ability of new businesses to quickly capture significant market share.
- Amazon held a 37.7% share of the U.S. e-commerce market in 2024.
- U.S. e-commerce sales are projected to grow by 10.8% in 2024.
- Retail e-commerce sales in the U.S. were $279.8 billion in Q1 2024.
- The need for substantial capital affects the ability of new companies to compete.
E-commerce: New Rivals & Market Dynamics
The e-commerce sector's low barriers enabled new rivals. Tools like Shopify simplified online store creation, boosting competition. Established giants and niche players intensified competition, challenging Buy.com's position. However, significant capital demands for scaling up restricted rapid market share gains.
| Aspect | Impact on Buy.com | 2024 Data |
|---|---|---|
| Ease of Entry | High threat from new entrants | Basic e-commerce setup cost under $1,000. |
| Platform Impact | Increased competition | U.S. e-commerce sales: ~$1.15T. |
| Established Retailers | Significant competition | Walmart e-commerce sales: ~$80B. |
Porter's Five Forces Analysis Data Sources
The analysis synthesizes data from SEC filings, market share reports, and industry publications.
It uses financial reports and competitor analysis to assess competitive forces within the sector.
Key market trends inform this strategic evaluation of the Buy.com, Inc. landscape.
