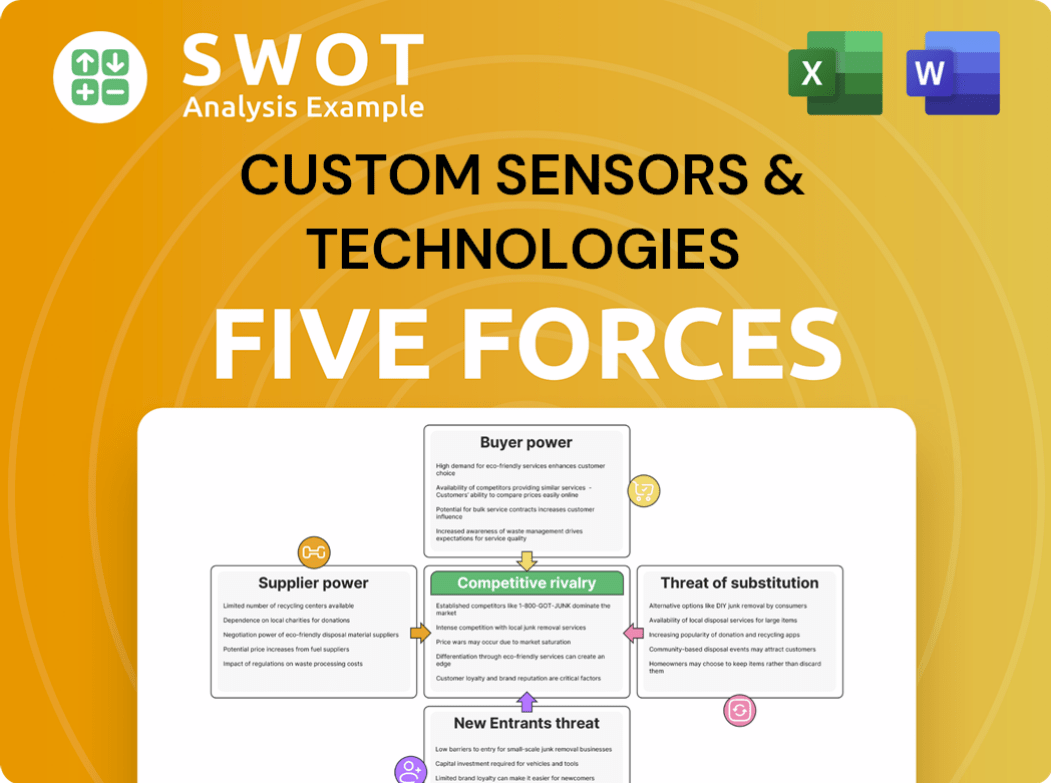
Custom Sensors & Technologies Porter's Five Forces Analysis
Fully Editable
Tailor To Your Needs In Excel Or Sheets
Professional Design
Trusted, Industry-Standard Templates
Pre-Built
For Quick And Efficient Use
No Expertise Is Needed
Easy To Follow
Custom Sensors & Technologies Bundle
What is included in the product
Tailored exclusively for Custom Sensors & Technologies, analyzing its position within its competitive landscape.
Customize Porter's Five Forces levels to assess competitive threats and refine strategies.
What You See Is What You Get
Custom Sensors & Technologies Porter's Five Forces Analysis
You're viewing the full Custom Sensors & Technologies Porter's Five Forces analysis. This detailed document, ready for immediate download, provides insights into the competitive landscape. It's identical to the file you'll receive upon purchase. No edits or changes are needed; it's prepared for your immediate use. This comprehensive analysis is ready when you are.

Porter's Five Forces Analysis Template
From Overview to Strategy Blueprint
Custom Sensors & Technologies faces moderate rivalry in its niche, balanced by some supplier power. Buyer power fluctuates depending on specific product lines & customer segments. The threat of new entrants is relatively low, due to high barriers. Substitutes pose a moderate challenge. Understand the true competitive landscape.
This brief snapshot only scratches the surface. Unlock the full Porter's Five Forces Analysis to explore Custom Sensors & Technologies’s competitive dynamics, market pressures, and strategic advantages in detail.
Suppliers Bargaining Power
Supplier Concentration
The bargaining power of suppliers for Custom Sensors & Technologies (CST) is moderate due to supplier concentration in the sensor market. Specialized suppliers of critical components can pressure pricing and terms. For instance, the top 3 sensor manufacturers control about 45% of the market. This concentration is offset by alternative suppliers for standard parts.
Switching Costs
Switching costs significantly impact supplier power for Custom Sensors & Technologies (CST). High switching costs, like re-engineering products, increase supplier leverage. For example, if CST must invest heavily to change sensor suppliers, existing suppliers can demand higher prices. Lower switching costs, allowing CST to easily change suppliers, reduce supplier power. In 2024, the average cost to retool a manufacturing line was roughly $500,000, highlighting the potential impact on CST's flexibility.

Input Differentiation
Custom Sensors & Technologies (CST) faces varying supplier power based on input differentiation. Suppliers of unique components, like those with patents, hold more power. This is because CST has fewer sourcing options. Conversely, suppliers of standardized components have less power. The availability of multiple vendors for these items limits their leverage. In 2024, the market for specialized sensors grew by approximately 8%, indicating the ongoing importance of differentiated inputs for companies like CST.
Impact on Quality
Suppliers of critical components significantly influence Custom Sensors & Technologies' (CST) sensor quality. High-quality inputs are essential for the precision and reliability of CST's sensors. CST's performance depends on these inputs, especially in sectors like aerospace and medical. CST must manage supplier relationships to ensure consistent quality and performance.
- Aerospace and defense sensor market was valued at $2.7 billion in 2023.
- Medical sensor market is projected to reach $15.8 billion by 2029.
- Industrial sensors market is expected to grow, with increasing quality demands.
Forward Integration Threat
The threat of suppliers moving forward into sensor manufacturing is a concern. Suppliers, if they have resources, could compete with Custom Sensors & Technologies (CST). This could pressure CST on pricing and supply terms, impacting its market position. The sensor manufacturing's complexity and high capital needs can limit this threat.
- The global sensors market was valued at $228.8 billion in 2023.
- Forward integration requires significant investment in manufacturing plants and R&D.
- Large sensor suppliers, like those in semiconductors, have high market power.
CST's Supplier Dynamics: Market Forces at Play
Supplier power for CST is moderate, influenced by concentration and switching costs. Specialized suppliers can exert pressure; however, the availability of alternatives limits leverage. The market for sensors, valued at $228.8 billion in 2023, also influences CST's strategies.
| Factor | Impact on CST | 2024 Data/Example |
|---|---|---|
| Supplier Concentration | Moderate to High | Top 3 sensor manufacturers control ~45% of market. |
| Switching Costs | Moderate | Retooling a line costs ~$500,000. |
| Input Differentiation | Varies | Specialized sensor market grew ~8%. |
Customers Bargaining Power
Customer Concentration
The bargaining power of Custom Sensors & Technologies' (CST) customers is moderate, shaped by the diverse industries it serves. Sectors like aerospace may wield greater influence due to strict demands and long-term agreements. CST's customer base includes transportation, industrial, medical, and aerospace, impacting its pricing strategies. In 2024, the industrial sensors market was valued at $16.7 billion, highlighting the competitive landscape.
Switching Costs
Switching costs significantly influence customer bargaining power for Custom Sensors & Technologies (CST). High costs, such as those from re-certifying or redesigning systems, weaken customer power. This allows CST to maintain pricing power. However, low switching costs, which are common in commodity sensors, boost customer power. In 2024, the sensor market saw an increase in readily available, interchangeable products.

Product Differentiation
Custom Sensors & Technologies (CST) leverages product differentiation to shape customer power. CST's ability to customize sensors and innovate technologically impacts customer influence. For example, in 2024, customized sensor sales accounted for 60% of CST's revenue. Highly differentiated products reduce customer price sensitivity, boosting CST's profitability. Conversely, commoditized offerings increase customer bargaining power, potentially squeezing margins.
Availability of Information
The availability of information significantly shapes customer bargaining power. Customers with comprehensive data on sensor performance, pricing, and competitors can negotiate better deals. Transparency in the sensor market is rising, empowering customers. This includes access to technical specifications and reliability data. Such access allows for informed purchase decisions.
- Online platforms offer detailed sensor comparisons.
- Real-time pricing data is increasingly accessible.
- Customer reviews and performance reports are readily available.
Backward Integration Threat
The threat of customers integrating backward into sensor manufacturing is generally low. Sensor manufacturing demands specialized expertise and significant capital investment, reducing the likelihood of most customers developing their own sensor solutions. However, large original equipment manufacturers (OEMs) with substantial resources could potentially pose a threat. In 2024, the sensor market was valued at approximately $240 billion, indicating the scale of investment needed.
- Backward integration is less of a threat due to high barriers to entry.
- Large OEMs could become a threat if they choose to invest.
- The sensor market's size requires considerable capital.
- Specialized expertise is a key factor.
CST's Customer Power: Switching Costs & Customization
Customer bargaining power at Custom Sensors & Technologies (CST) is shaped by industry specifics and switching costs. While high switching costs, like re-certification, protect CST, readily available sensors boost customer influence. CST's product differentiation, with customized sensors, reduces customer price sensitivity; in 2024, 60% of CST's revenue came from these.
| Factor | Impact on Customer Power | 2024 Data/Insight |
|---|---|---|
| Switching Costs | High costs decrease power | Re-certification costs matter |
| Product Differentiation | High differentiation decreases power | 60% of revenue from customization |
| Information Availability | Increased info boosts power | Online comparisons and pricing are accessible |
Rivalry Among Competitors
Market Concentration
Competitive rivalry in the custom sensor market is intense. The market features a blend of large, established firms and smaller, specialized companies. Market concentration levels fluctuate depending on the sensor type and its specific application. In 2024, the top 5 custom sensor manufacturers held approximately 40% of the market share. This concentration drives strong competition.
Industry Growth
Industry growth significantly influences competitive dynamics within the sensor market. Rapid expansion, fueled by industrial automation and IoT, draws in new competitors, intensifying rivalry. The sensor market's robust growth, estimated at 8-10% annually in 2024, is driven by technological advancements. This growth encourages existing players to compete aggressively for market share, creating a dynamic environment.

Product Differentiation
Product differentiation significantly affects competitive rivalry within the sensor market. Companies with unique, customized offerings often experience less intense competition. CST's specialization in custom sensors provides a competitive edge. In 2024, the market for specialized sensors grew by 8%, reflecting demand for differentiated products. This strategy helps CST manage competitive pressures effectively.
Switching Costs
Switching costs significantly influence competitive rivalry in the sensor market. Low switching costs make it easy for customers to swap between Custom Sensors & Technologies and its competitors, intensifying competition. Conversely, high switching costs, like those associated with complex system integrations, can create customer lock-in. The sensor market often sees moderate switching costs due to integration complexities.
- Customer acquisition costs in the sensor market average between 5% and 15% of the contract value, reflecting the effort needed to onboard new clients.
- The time to integrate a new sensor system can range from a few weeks to several months, adding to switching costs.
- Approximately 60% of sensor users report some level of integration difficulty when switching providers.
- In 2024, the global industrial sensor market was valued at $22.5 billion.
Exit Barriers
High exit barriers, like specialized assets or contracts, fuel rivalry. Firms stay despite low profits, intensifying price wars and hurting industry appeal. The sensor sector typically faces moderate exit hurdles. This dynamic influences strategic decisions. In 2024, the sensor market's competitive landscape showed this effect.
- Specialized assets can lock companies in.
- Long-term contracts complicate exits.
- Moderate barriers still allow some flexibility.
- Competitive intensity varies with exit costs.
Sensor Market: Fierce Competition Unveiled!
Competitive rivalry in the custom sensor market is characterized by intense competition. In 2024, market concentration showed the top 5 manufacturers held roughly 40% of the market share. Product differentiation and switching costs play crucial roles in shaping competition dynamics.
| Factor | Impact | 2024 Data |
|---|---|---|
| Market Concentration | Influences competition intensity | Top 5 firms: ~40% share |
| Growth Rate | Attracts new entrants | Market grew 8-10% annually |
| Differentiation | Reduces competition | Specialized sensors grew 8% |
SSubstitutes Threaten
Availability of Substitutes
The threat of substitutes for Custom Sensors & Technologies is moderate, varying by application. Alternative sensing tech or non-sensor solutions can replace sensors. The sensor market's competitiveness hinges on substitute availability. For example, in 2024, the market for proximity sensors, a CST segment, was valued at $2.8 billion; alternatives exist but aren't always ideal.
Switching Costs
Switching costs significantly influence the threat of substitutes. If customers face minimal costs to switch, they're more likely to adopt alternatives. Re-engineering systems for new tech can create moderate switching costs. Custom Sensors & Technologies' moderate switching costs, like in 2024, may arise from system adjustments. This impacts the ease with which customers might choose different sensors.

Price Performance
The price-performance of substitutes significantly impacts their appeal. If substitutes offer similar functionality at a lower cost, they become a real threat. Sensor technology is advancing with AI and machine learning integration, enhancing data analysis. In 2024, the market saw a 15% increase in AI-integrated sensors, highlighting this shift.
Technological Advancements
Technological advancements are a significant threat to Custom Sensors & Technologies. Innovations can lead to new substitutes or enhance existing ones, impacting market share. The fast-paced changes in sensing technologies require constant vigilance for potential substitutes. For instance, smart temperature sensors offer real-time data collection and remote monitoring capabilities. This shift highlights the need to adapt and innovate to stay competitive.
- The global smart sensors market was valued at $42.8 billion in 2023.
- It is projected to reach $80.8 billion by 2028, with a CAGR of 13.5% from 2023 to 2028.
- The rise of IoT and demand for miniaturization are key drivers.
- Companies must invest in R&D to stay ahead of substitute technologies.
Customer Preferences
Customer preferences significantly shape the adoption of substitute products. If clients are content with existing sensor tech, substitutes face an uphill battle. Yet, evolving demands and a push for integrated systems can heighten the threat. For instance, in 2024, the market for advanced sensors grew, with the industrial sector showing a 7% increase in demand for integrated solutions, indicating a shift in customer needs.
- Customer satisfaction with current sensor technology lowers the threat of substitutes.
- Demand for integrated solutions increases the threat.
- Industrial sector demand for integrated solutions grew by 7% in 2024.
- Customer needs are continuously changing.
Substitutes' Impact on Sensor Tech: A 2024 Analysis
The threat of substitutes for Custom Sensors & Technologies is moderate, influenced by technological advancements and customer needs. Switching costs and price-performance ratios are key factors impacting the adoption of alternatives. In 2024, the integration of AI in sensors increased by 15%, emphasizing the need for innovation. The global smart sensors market was valued at $42.8 billion in 2023.
| Factor | Impact | 2024 Data |
|---|---|---|
| Switching Costs | Moderate impact on adoption | System adjustments create costs |
| Price-Performance | Crucial for substitute appeal | Advancements with AI and ML |
| Customer Preferences | Shape substitute adoption | Industrial sector demand +7% |
Entrants Threaten
Barriers to Entry
The threat of new entrants in the custom sensor market is moderate. High capital needs, technological expertise, and brand reputation create barriers. For example, the pharmaceutical industry requires substantial R&D investment. In 2024, the average R&D spending for top pharmaceutical companies was around $8 billion.
Capital Requirements
High capital demands for R&D, manufacturing, and marketing pose a major entry barrier. For example, establishing a new semiconductor fab might cost billions, as seen in the 2024 investments by companies like Intel. While contract manufacturing helps, the need for specialized equipment and expertise still requires substantial initial investment. Open-source tech offers some relief, but the complexity of sensor technology often necessitates significant upfront spending. The capital intensity of the industry, especially in advanced sensor development, deters many new players.

Technological Expertise
Sensor design and manufacturing demand specialized technological expertise, posing a significant hurdle for new entrants. Companies like TE Connectivity, a major player, benefit from strong R&D, with 2024 revenues of $17.2 billion, highlighting their competitive edge. Miniaturization and rising industrial demands further increase the need for specialized capabilities. This trend is reflected in the sensor market's projected growth; the global market is estimated to reach $260 billion by 2027.
Brand Reputation
Brand reputation significantly impacts the threat of new entrants. Established firms like Custom Sensors & Technologies benefit from strong brand recognition and customer loyalty, creating a barrier. Building a comparable brand requires substantial time and financial investment, making it difficult for newcomers. In 2024, companies with strong brands saw customer retention rates averaging 80%, highlighting the advantage. This is especially true where products are unique.
- High brand equity translates to customer trust, making it harder for new firms to compete.
- Established brands often have pricing power, further hindering new entrants.
- Marketing and advertising costs are higher for new entrants to gain visibility.
- Loyalty programs and repeat purchases reinforce brand advantages.
Regulatory and Standards
Regulatory hurdles pose a significant threat to new entrants in the custom sensors market. Compliance with stringent industry-specific regulations and standards, especially in sectors like aerospace and medical, demands substantial investment. For example, meeting the requirements of the International Organization for Standardization (ISO) can be a costly and time-consuming process. This increases the financial burden and delays market entry for newcomers. The industrial automation sector, a key growth area, relies heavily on accurate temperature data for optimal operation, efficiency, and safety, further intensifying regulatory scrutiny.
- Compliance Costs: New entrants face significant expenses to meet industry-specific regulations, impacting their initial investments.
- Time to Market: Navigating regulatory processes can delay the launch of new products, affecting competitive positioning.
- Industry Focus: Sectors such as aerospace and medical have stricter standards, creating higher barriers.
- Automation Impact: The growth in industrial automation increases the importance of compliance for sensor accuracy and safety.
Navigating the Barriers to Entry
The threat from new entrants is moderate due to high barriers. Substantial capital investments in R&D and manufacturing, along with technological expertise, are required. Established brand reputations and regulatory hurdles also increase the difficulty for new companies.
| Barrier | Impact | Example (2024) |
|---|---|---|
| Capital Needs | High Investment | Semiconductor fab costs billions. |
| Tech Expertise | Specialized Skills | TE Connectivity's $17.2B revenue. |
| Brand Reputation | Customer Trust | 80% retention for strong brands. |
Porter's Five Forces Analysis Data Sources
Our analysis leverages data from market research, financial filings, and industry reports for insights. We also incorporate competitor analysis and economic indicators.
