Foot Locker Boston Consulting Group Matrix
Fully Editable
Tailor To Your Needs In Excel Or Sheets
Professional Design
Trusted, Industry-Standard Templates
Pre-Built
For Quick And Efficient Use
No Expertise Is Needed
Easy To Follow
Foot Locker Bundle
What is included in the product
Strategic assessment of Foot Locker's business units within BCG Matrix, focusing on growth and resource allocation.
Export-ready design for quick drag-and-drop into PowerPoint, presenting strategic insights about Foot Locker's portfolio.
What You’re Viewing Is Included
Foot Locker BCG Matrix
The Foot Locker BCG Matrix preview is the same file you'll receive after purchase. This fully editable, ready-to-use report provides strategic insights, with no hidden content or watermarks.

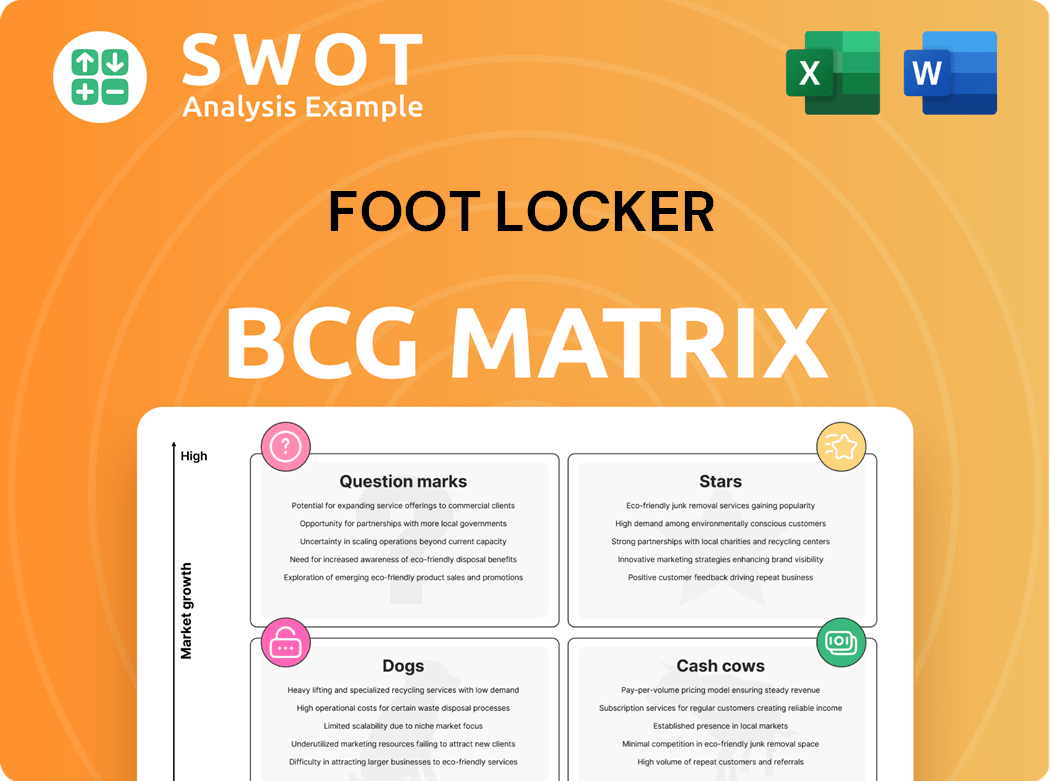
BCG Matrix Template
See the Bigger Picture
Foot Locker navigates a dynamic retail landscape. Their BCG Matrix classifies products by market share and growth. Learn how Foot Locker’s offerings—from iconic sneakers to apparel—fare in each quadrant. This initial peek scratches the surface of strategic positioning. Dive deeper into this company’s BCG Matrix and gain a clear view of where its products stand—Stars, Cash Cows, Dogs, or Question Marks. Purchase the full version for a complete breakdown and strategic insights you can act on.
Stars
Reimagined Store Concept
Foot Locker's 'Reimagined' stores are boosting growth, showing strong returns. The company intends to speed up their rollout, with 80 slated for 2025. These stores improve brand image and focus on customer experience. In 2024, Foot Locker's sales reached $7.4 billion, showing the impact of these initiatives.
FLX Rewards Program
The revamped FLX Rewards Program is a key driver for Foot Locker's strategy, significantly boosting customer loyalty. The program's success is evident in the growth, with 3.2 million new members in Q4 2024. This growth has improved the loyalty sales capture rate. Foot Locker aims to expand FLX to Europe in 2025, which will improve customer engagement.

Digital Sales Growth
Foot Locker's digital sales are a "Star" in its BCG matrix. Global digital comps grew year over year, showing strong results. Digital sales penetration improved, supporting the company's 2026 e-commerce goals. Foot Locker is investing in digital with a new mobile app. In 2024, digital sales comprised approximately 20% of total sales.
Partnerships with Key Brands
Foot Locker shines with key brand partnerships. Its collaborations, especially with Nike and Adidas, are a major strength. They build multi-year growth plans together, aiming for multi-brand leadership. Exclusive partnerships give Foot Locker an edge in the market. This strategy helped Foot Locker achieve $7.4 billion in sales in 2024.
- Strong brand collaborations with Nike and Adidas.
- Focus on multi-year growth plans.
- Aim for multi-brand leadership.
- Exclusive partnerships provide a competitive advantage.
Positive Comparable Sales Growth
Foot Locker's recent performance showcases a positive trend, primarily due to the success of its core brands. The "Lace Up Plan" has been pivotal in enhancing sales and profitability, showcasing the company's strategic effectiveness. Foot Locker anticipates sustained positive comparable sales growth in fiscal year 2025, reflecting confidence in its strategies. This positive trajectory is crucial for its position in the market.
- Positive Comparable Sales Growth: Driven by Foot Locker and Kids Foot Locker banners.
- Lace Up Plan Success: Fuels sales growth and margin improvements.
- Fiscal Year 2025 Outlook: Forecasts continued positive comps growth.
Digital Dominance & Strategic Alliances Fuel Growth
Foot Locker's digital sales, key brand partnerships, and "Reimagined" stores are Stars in its BCG matrix, driving substantial growth. Digital sales contribute about 20% of total sales, showing solid expansion. The company’s collaborations, especially with Nike and Adidas, are a major strength.
| Aspect | Details | 2024 Data |
|---|---|---|
| Digital Sales | Contribution to total sales | Approximately 20% |
| Sales | Total Sales | $7.4 Billion |
| FLX Rewards | New Members in Q4 | 3.2 Million |
Cash Cows
Foot Locker Brand
The Foot Locker brand, especially in established markets, is a cash cow due to its strong brand recognition and loyal customer base. Although growth might be slower in mature markets, the brand consistently generates revenue. Foot Locker focuses on enhancing its in-store experience to maintain its market position. In Q3 2023, Foot Locker's sales decreased by 8.5%, but the company is working on strategic initiatives. The brand remains a key player in the athletic footwear retail industry.
Kids Foot Locker Brand
Kids Foot Locker, like its parent brand, leverages strong brand recognition, focusing on a specific niche. The banner reported positive comparable sales growth in 2024. The company's strategy includes store refreshes and consistent brand experiences to maintain customer engagement. In Q1 2024, Foot Locker reported that Kids Foot Locker had a positive sales trend.

Apparel Sales (Select Items)
Foot Locker's apparel sales, especially items linked to popular footwear releases, can act as cash cows. These apparel pieces benefit from high-demand footwear, ensuring consistent sales. Foot Locker leverages storytelling and collections to link apparel with footwear, boosting sales. In 2024, apparel sales accounted for a significant portion of their revenue, though the precise figures vary by quarter.
Accessories
Accessories at Foot Locker, including socks and shoe care, are cash cows due to consistent revenue and low investment needs. These items appeal to existing customers, boosting profitability. Foot Locker's services, like sneaker cleaning, add to this revenue stream. The company's strategy focuses on high-margin add-ons to enhance financial performance.
- Foot Locker's gross profit margin was around 30% in 2024, showing strong profitability from accessories.
- The accessories market is estimated to be worth billions, with steady growth.
- Services like sneaker cleaning contribute a smaller but profitable segment.
Strong Store Locations
Foot Locker's prime locations in high-traffic areas are cash cows, generating steady revenue. These stores, found in A and B malls, enjoy consistent customer flow and brand recognition. The company is optimizing its store network by reducing its presence in less profitable locations. This strategic move helps maintain profitability.
- Foot Locker's revenue in 2023 was $7.4 billion.
- The company operates approximately 2,600 stores globally.
- Foot Locker aims to close underperforming stores to enhance profitability.
- High-traffic locations contribute significantly to overall sales.
Cash Cows Fueling Consistent Profitability
Foot Locker's cash cows, including its core brand and Kids Foot Locker, generate steady revenue. Apparel sales tied to popular footwear also act as cash cows, boosted by strategic marketing. Accessories and prime retail locations further contribute to consistent profitability, as seen by a 30% gross profit margin in 2024.
| Category | Description | 2024 Data |
|---|---|---|
| Core Brand | Strong brand recognition & loyal base | Positive sales trends in 2024. |
| Kids Foot Locker | Leverages brand for niche market | Positive comparable sales growth. |
| Apparel | Linked to footwear releases | Significant portion of revenue. |
Dogs
Lower-Tier Mall Locations
Foot Locker is shutting down underperforming stores, with a focus on lower-tier mall locations. These spots face challenges due to weaker foot traffic and sales compared to other locations. As of 2024, Foot Locker aims to shutter around 400 mall stores by 2026. In Q1 2024, the company reported a 1.8% decrease in sales, signaling the need for these closures.
WSS Brand (Potentially)
Foot Locker's WSS brand faces challenges, particularly in specific markets. The brand's performance is under scrutiny as the company assesses its banners. In 2024, Foot Locker's net sales decreased by 1.8% compared to the same period in 2023, reflecting overall market difficulties. This could place WSS in the 'dog' category. Foot Locker's strategic adjustments will determine WSS's future.

International Markets (Exiting)
Foot Locker is exiting international markets like Denmark, Norway, Sweden, and South Korea. These regions likely underperformed, hindering growth. The move focuses on more profitable areas. In 2024, Foot Locker reported a revenue decrease of 2% in Europe, Middle East, and Africa.
Apparel Sales (Overall)
Foot Locker's apparel sales are struggling, with revenue showing a downward trend, indicating underperformance. This could place the apparel segment in the 'dog' category of the BCG matrix. The company is trying to revitalize this area through new apparel offerings. In Q3 2024, apparel sales decreased, impacting overall performance.
- Revenue decline in apparel sales.
- Underperforming segment.
- Efforts to innovate apparel offerings.
- Impact on overall company performance.
Unsuccessful Digital Initiatives
Digital initiatives at Foot Locker that don't perform well are "dogs." These initiatives drain resources without boosting profit or growth. For instance, in 2024, Foot Locker's digital sales were approximately 20% of total sales, indicating areas needing improvement. The company is working to improve its online shopping experience. Foot Locker's digital marketing spend was around $150 million in 2024.
- Underperforming digital projects are categorized as "dogs."
- They consume resources without delivering returns.
- Foot Locker aims to enhance its digital presence.
- Focus is on improving the online shopping experience.
Struggling Stores: Key Data Points
Underperforming stores, like those in low-traffic malls, are "dogs" due to declining sales. Brands like WSS may also fall into this category, given the company's strategic assessment. Apparel sales and underperforming digital initiatives further contribute to the "dogs" classification.
| Category | Description | 2024 Data |
|---|---|---|
| Store Closures | Underperforming stores | 400 mall stores by 2026 |
| WSS Brand | Under scrutiny | Net sales decreased by 1.8% |
| Digital Initiatives | Underperforming projects | Digital sales ~20% of total |
Question Marks
Emerging Athletic Brands
Foot Locker's embrace of HOKA and On signals a "Question Mark" in its BCG Matrix. These brands show promise but have small market shares. Foot Locker seeks new customers and less dependence on giants. For example, HOKA's sales surged 27% in 2023. This strategy aims for future growth.
New Digital Initiatives
Foot Locker's new digital initiatives, including its mobile app, are question marks. These ventures aim to boost customer engagement and sales. However, they need investment and might not instantly pay off. In 2024, Foot Locker invested in digital capabilities, reflecting the changing retail scene. Digital sales represented approximately 20% of total sales in 2023.

Expansion into Europe with FLX
Foot Locker's FLX Rewards Program expansion into Europe is a question mark within its BCG Matrix. Success in North America doesn't guarantee similar performance in Europe. The company aims to boost customer engagement and sales with FLX there. In 2023, Foot Locker's European sales were about $2.5 billion, showing potential.
Off-Mall Locations
Foot Locker's move to off-mall sites is a question mark in its BCG matrix. This change aims to draw in new customers and lessen dependence on malls, though success isn't assured. The company is adjusting its real estate strategy, opening new store formats outside malls. This shift could boost sales, but it also introduces risks. The off-mall strategy is a key area for Foot Locker's future.
- Foot Locker plans to open more off-mall stores in 2024.
- This strategy is part of their growth plan.
- Off-mall locations offer new customer reach.
- Success depends on effective execution.
Champs Sports Repositioning
Champs Sports' repositioning as the home of sport style is a "question mark" in Foot Locker's BCG matrix. The launch of its "Sport for Life" platform targets a specific customer segment, but its success is uncertain [1, 2]. Building on this new positioning, Champs Sports aims to attract a particular demographic. This strategy requires significant investment and market adaptation.
- The "question mark" status signifies high market growth potential but low market share.
- "Sport for Life" platform targets a specific customer segment.
- Success depends on effective execution and market acceptance.
- Champs Sports needs to build upon its new position.
Strategic Moves: Uncertainty and Growth
Foot Locker's "Question Marks" are strategic bets with potential, but uncertain outcomes. These initiatives, like off-mall stores and Champs Sports' repositioning, seek growth in evolving markets. Success hinges on execution and adaptation, demanding careful management. Foot Locker's digital investments reflect its agility.
| Initiative | Description | 2024 Context |
|---|---|---|
| Off-Mall Expansion | New stores outside malls to attract customers. | Planning for more off-mall stores in 2024. |
| Champs Repositioning | "Sport for Life" platform targets a specific segment. | Requires investment, depends on market acceptance. |
| Digital Initiatives | Mobile app and other digital enhancements. | Aim to boost customer engagement. |
BCG Matrix Data Sources
The Foot Locker BCG Matrix leverages financial statements, market analysis, and retail industry reports. These diverse sources offer critical data.
