Franklin Templeton Porter's Five Forces Analysis
Fully Editable
Tailor To Your Needs In Excel Or Sheets
Professional Design
Trusted, Industry-Standard Templates
Pre-Built
For Quick And Efficient Use
No Expertise Is Needed
Easy To Follow
Franklin Templeton Bundle
What is included in the product
Tailored exclusively for Franklin Templeton, analyzing its position within its competitive landscape.
Instantly identify competitive forces with an intuitive color-coded matrix.
Full Version Awaits
Franklin Templeton Porter's Five Forces Analysis
This preview offers a glimpse into the Franklin Templeton Porter's Five Forces Analysis report. The complete analysis, as you see it now, will be instantly available after your purchase. It's a fully realized document, ready for your use—no alterations needed. This is the entire deliverable, prepared for immediate download and application.

Porter's Five Forces Analysis Template
A Must-Have Tool for Decision-Makers
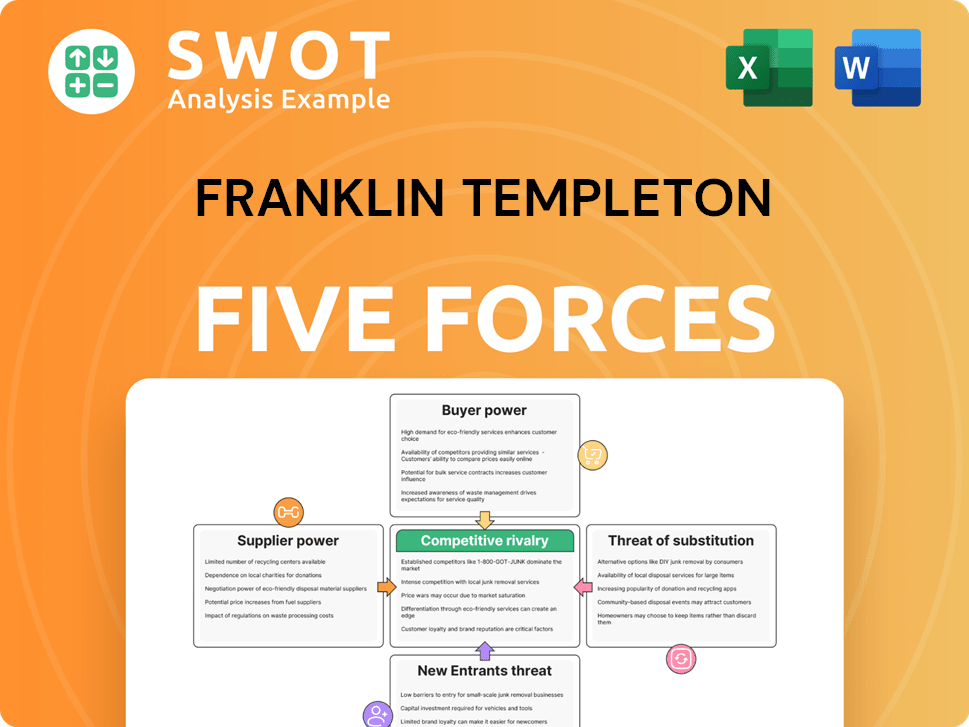
Franklin Templeton navigates a dynamic asset management landscape. Analyzing Porter's Five Forces reveals critical competitive pressures. These forces include the bargaining power of buyers and suppliers, and the threat of new entrants. Also, the intensity of rivalry and substitutes impacts Franklin Templeton's market position. Understanding these forces is crucial for strategic planning and investment decisions. This brief snapshot only scratches the surface. Unlock the full Porter's Five Forces Analysis to explore Franklin Templeton’s competitive dynamics, market pressures, and strategic advantages in detail.
Suppliers Bargaining Power
Limited Supplier Concentration
Franklin Templeton, a global investment firm, leverages its size to counter supplier power. The fragmented supplier market benefits them, limiting any single supplier's influence. Numerous alternatives for services and tech further weaken supplier leverage. For instance, in 2024, their diverse tech partnerships kept costs competitive. This approach ensures they can negotiate favorable terms.
Standardized Service Inputs
Franklin Templeton benefits from standardized service inputs, like IT support and data services. This standardization reduces supplier bargaining power. The company can switch vendors easily, fostering competitive pricing. This flexibility is crucial in cost management. In 2024, the IT services market was valued at over $1.4 trillion globally.

In-House Capabilities
Franklin Templeton's robust in-house capabilities, spanning investment research and technology, significantly bolster its bargaining power. This internal expertise allows for greater control over critical processes, reducing dependence on external suppliers. For instance, in 2024, Franklin Templeton's tech spending rose by 12%, reflecting their investment in internal development. This strategic move strengthens their negotiation position with vendors.
Global Reach
Franklin Templeton's global reach is a key strength in managing supplier power. The company's international operations enable it to source services from various locations, optimizing costs and accessing diverse supplier options. This global sourcing strategy weakens the influence of local or regional suppliers. A worldwide perspective enables Franklin Templeton to seek the best value.
- Global presence facilitates access to competitive pricing and services.
- Diversification of suppliers reduces reliance on any single entity.
- Leveraging international markets enhances negotiation leverage.
- Cost efficiencies are achieved through global sourcing.
Regulatory Oversight
The financial services industry operates under strict regulatory oversight, significantly influencing supplier dynamics. Compliance mandates, such as those from the SEC in the U.S. or the FCA in the UK, restrict the number of qualified suppliers. This standardization reduces supplier flexibility and bargaining power. For example, in 2024, the average cost of compliance for financial institutions increased by 7% due to evolving regulatory demands.
- Increased Compliance Costs: The average cost of regulatory compliance rose by 7% in 2024.
- Standardized Agreements: Regulatory needs lead to more uniform and less negotiable supplier contracts.
- Limited Supplier Pool: Regulatory requirements restrict the number of suppliers.
Size & Reach: The Key to Supplier Power
Franklin Templeton combats supplier power through size and global reach. They leverage a fragmented supplier market to limit any single entity's influence. This approach, along with in-house capabilities, boosts their negotiation power.
| Aspect | Detail | 2024 Data |
|---|---|---|
| Market | IT Services Market | $1.4T Global Value |
| Expenditures | Tech Spending Increase | 12% Rise |
| Compliance | Average Cost Increase | 7% Hike |
Customers Bargaining Power
High Customer Choice
The investment management industry's competitive landscape, with numerous firms, gives customers considerable power. This wide choice enables clients to seek better performance, lower fees, and tailored services. For instance, in 2024, the average expense ratio for actively managed U.S. equity funds was around 0.7%, while passive funds were much lower. Customer choice significantly influences competitive dynamics.
Switching Costs are Low
Customers' ability to switch investment managers easily, especially in liquid assets, is a key factor. This ease increases customer power, compelling Franklin Templeton to offer superior value. Around 14% of investors switched firms in 2024, highlighting the impact of low switching costs. This dynamic necessitates strong client relationships and consistent performance.

Access to Information
Customers now have unprecedented access to financial information, thanks to the internet and various online platforms. This increased access empowers them to compare investment options and evaluate manager performance more effectively. As a result, customers are more informed and can demand better terms, like lower fees and higher service standards. For example, in 2024, the average expense ratio for actively managed U.S. equity mutual funds was 0.71%, while passive funds were much lower.
Demand for Performance
The bargaining power of customers significantly affects Franklin Templeton, primarily due to their focus on investment performance. Clients, highly sensitive to returns, can swiftly move their assets if performance lags, creating constant pressure on Franklin Templeton. This necessitates consistent outperformance of benchmarks to retain and attract clients. Performance pressure is a significant factor in client relationships, influencing strategic decisions.
- Client outflows can be substantial; in 2024, underperforming funds faced significant redemption pressures.
- Benchmarks like the S&P 500 or specific sector indices are critical performance targets.
- Performance fees generate a substantial portion of revenues, and underperformance directly impacts profitability.
- Client retention rates are closely tied to fund performance over 1, 3, and 5-year periods.
Fee Sensitivity
Fee sensitivity is a significant factor in the investment management industry, impacting firms like Franklin Templeton. Clients, both institutional and retail, are increasingly focused on fees, leading to pressure for lower costs. This trend necessitates competitive pricing strategies to retain and attract clients while maintaining profitability. Fee compression directly affects revenue and profitability margins in the financial sector.
- In 2024, the average expense ratio for actively managed U.S. equity funds was around 0.75%.
- Passive funds, such as ETFs, continue to exert pricing pressure, with expense ratios often below 0.10%.
- Franklin Templeton has been actively expanding its ETF offerings to meet the demand for lower-cost investment options.
- Fee compression has led to industry consolidation, with smaller firms struggling to compete.
Investors' Power: Shaping the Investment Landscape
Customers hold considerable power in the investment management industry, influencing firms like Franklin Templeton. Their ability to switch managers easily, especially in liquid assets, is a key driver of this power, with about 14% of investors switching firms in 2024. The pressure to perform and offer competitive fees is intense.
Clients are highly sensitive to investment returns, moving assets if performance lags. This directly affects profitability, as underperforming funds faced significant redemption pressures in 2024. Fee sensitivity also plays a significant role; in 2024, the average expense ratio for actively managed U.S. equity funds was around 0.75%, while passive funds are often below 0.10%.
| Factor | Impact | 2024 Data |
|---|---|---|
| Switching Rate | High | 14% of investors switched firms |
| Expense Ratio (Active) | Pressure to Lower Fees | 0.75% |
| Expense Ratio (Passive) | Low Cost Alternatives | <0.10% |
Rivalry Among Competitors
Intense Competition
The asset management industry is fiercely competitive, with many firms chasing market share. This rivalry pushes companies to stand out through performance, new products, and top-notch client service. For example, in 2024, the top 10 global asset managers managed trillions of dollars, highlighting the scale and competition. This competitive intensity shapes the industry's dynamics.
Fee Pressure
Competitive rivalry significantly impacts Franklin Templeton due to industry-wide fee pressure. Management fees are declining, forcing firms to adjust. In 2024, average expense ratios for actively managed equity funds were around 0.75%, while passive funds were much lower. This competition impacts profitability.

Product Innovation
Firms consistently innovate, creating new investment products and strategies to gain clients. Innovation is key for competitiveness in the financial sector. In 2024, the asset management industry saw a surge in ETFs, with over $11 trillion in assets. Product innovation fuels market changes and client growth, with sustainable investing assets reaching $2.7 trillion in Q3 2024.
Global Expansion
Many firms, including Franklin Templeton, are expanding globally, aiming for new markets and client diversification. This overlaps competition, forcing adaptation to local conditions. Global expansion boosts rivalry, compelling firms to innovate and cut costs. For example, in 2024, global assets under management (AUM) for the top 10 firms grew by about 7%, intensifying competition.
- Global AUM growth in 2024 signifies increased competition.
- Expansion requires firms to understand and cater to local markets.
- Firms need to innovate and manage costs effectively.
- Franklin Templeton competes with other global asset managers.
Consolidation
The asset management industry is consolidating, with major players absorbing smaller firms to boost their scale and service offerings. This trend intensifies competitive rivalry, creating larger, more robust competitors. Consolidation reshapes the competitive landscape, increasing the stakes for all participants. For instance, in 2024, there were several notable acquisitions in the financial sector.
- BlackRock's acquisition of Global Infrastructure Partners in 2024 for $12.5 billion.
- In 2024, the assets under management (AUM) for the top 10 global asset managers reached over $40 trillion.
- Consolidation is driven by the need for greater economies of scale and broader distribution networks.
Asset Management: Navigating the Competitive Landscape
Competitive rivalry in asset management is high, with firms vying for market share. This competition drives innovation in products and services. Fee pressure and global expansion intensify the rivalry. Consolidation further reshapes the landscape.
| Aspect | Details | 2024 Data |
|---|---|---|
| AUM Growth | Growth in assets under management | Top 10 firms grew by ~7% |
| Expense Ratios | Average for actively managed equity funds | ~0.75% |
| ETF Assets | Total assets in ETFs | Over $11 trillion |
SSubstitutes Threaten
Passive Investing
The surge in passive investing, fueled by index funds and ETFs, presents a considerable challenge to active managers like Franklin Templeton. Passive strategies typically boast lower fees, and in some markets, they've matched or outperformed active managers. In 2024, passive funds held over $15 trillion globally, a substantial increase from $8 trillion in 2018. This expansion signals a major shift in the investment landscape.
Robo-Advisors
Robo-advisors pose a threat by offering automated, low-cost investment services. They compete with traditional advisors by targeting specific client segments. In 2024, the assets under management (AUM) in the robo-advisor industry are estimated to be around $1 trillion globally. This expansion makes investment management services more accessible.

Alternative Investments
Investors are increasingly turning to alternative investments like private equity and real estate. These options serve as substitutes for traditional assets. Alternatives offer potential for higher returns, yet they also entail increased risk and illiquidity. In 2024, the private equity market saw significant growth. It provides diversification and opportunities for higher returns.
Direct Investing
Direct investing poses a threat as online platforms make it easier for investors to manage their own funds. This shift allows individuals to bypass traditional managers, increasing the competition. Technology plays a key role, fostering direct market participation. In 2024, approximately 65% of U.S. investors use online brokers. This trend impacts asset managers like Franklin Templeton.
- Online platforms provide easy access to financial markets.
- Direct investing empowers individuals to manage their own portfolios.
- Technology facilitates direct market participation.
- In 2024, 65% of U.S. investors use online brokers.
Real Estate
Real estate serves as a direct substitute, drawing investors seeking tangible assets and stable returns, differing from financial markets. This sector offers diversification, capital appreciation, and rental income opportunities, appealing to those looking beyond traditional investments. In 2024, the U.S. housing market saw a median home price of around $400,000, reflecting its attractiveness as an alternative investment. The real estate market's value is approximately $43.8 trillion in the United States.
- Real estate's tangible nature and potential for income generation make it a compelling substitute.
- The U.S. housing market's median price around $400,000 in 2024 highlights its appeal.
- Real estate's overall value is about $43.8 trillion in the United States.
- Investors use real estate for diversification and as a hedge against inflation.
Alternatives Challenge: Investment Landscape Shifts
The threat of substitutes significantly impacts Franklin Templeton, with investors increasingly opting for alternatives. Passive investments, like ETFs, grew to over $15 trillion globally by 2024. Robo-advisors, managing around $1 trillion, offer automated, low-cost services, further diversifying options.
| Substitute | Description | 2024 Data |
|---|---|---|
| Passive Funds | Index funds and ETFs | $15T+ global AUM |
| Robo-Advisors | Automated investment services | ~$1T global AUM |
| Direct Investing | Online platforms for self-management | 65% of US investors use online brokers |
Entrants Threaten
High Capital Requirements
The investment management industry faces a high barrier to entry due to substantial capital demands. Establishing a strong reputation and infrastructure, along with attracting skilled professionals, necessitates significant financial investment. The costs for new firms to effectively compete are considerable. For example, in 2024, the average cost to launch a new hedge fund was between $5 million and $10 million. This financial hurdle limits the number of potential entrants.
Regulatory Hurdles
The financial industry is heavily regulated. New entrants, like Franklin Templeton, face complex regulatory requirements. Compliance is a significant barrier to entry. Navigating these regulations demands expertise and resources. In 2024, regulatory costs for financial firms averaged around $100 million annually.

Brand Reputation
Franklin Templeton's established brand is a significant advantage. It has a long history and strong reputation. New entrants struggle to replicate this trust. Brand recognition creates a barrier to entry. A strong brand helps retain clients. In 2024, Franklin Templeton managed over $1.5 trillion in assets, reflecting brand strength.
Economies of Scale
Large asset managers, like Franklin Templeton, enjoy economies of scale, which help lower fees and fund technology and research. New entrants face cost challenges due to smaller sizes. Scale creates cost efficiencies, making it hard to compete on price. This advantage protects established firms from new challengers. The top 10 U.S. asset managers control over 50% of industry assets, showing scale's power.
- Economies of scale allow for lower fees.
- New entrants struggle to match costs.
- Scale provides cost efficiencies.
- Established firms are protected.
Access to Distribution
New entrants in the financial industry face significant hurdles in accessing distribution networks. Gaining a foothold with financial advisors and institutional clients is tough because established firms like Franklin Templeton already have strong distribution channels. These networks are essential for reaching clients and building assets under management (AUM). Replicating these distribution systems requires considerable time, resources, and industry relationships.
- Established firms often have long-standing relationships with key distribution partners.
- New entrants may need to offer higher incentives or lower fees to attract distribution partners.
- Regulatory hurdles and compliance costs can also impact distribution strategies.
- Building brand recognition and trust is crucial for gaining access to distribution.
Investment Management: Barriers to Entry
The threat of new entrants to the investment management industry is moderate, considering high barriers. Significant capital, compliance costs, and brand recognition pose challenges. Established firms like Franklin Templeton have competitive advantages.
| Barrier | Impact | 2024 Data |
|---|---|---|
| Capital Costs | High | Hedge fund launch: $5-10M |
| Regulation | Complex | Compliance costs: ~$100M/yr |
| Brand & Scale | Strong | FT AUM: ~$1.5T, Top 10 firms control >50% assets |
Porter's Five Forces Analysis Data Sources
This analysis uses financial reports, industry databases, and market research to evaluate Franklin Templeton's competitive forces. We also consult SEC filings and analyst reports.
