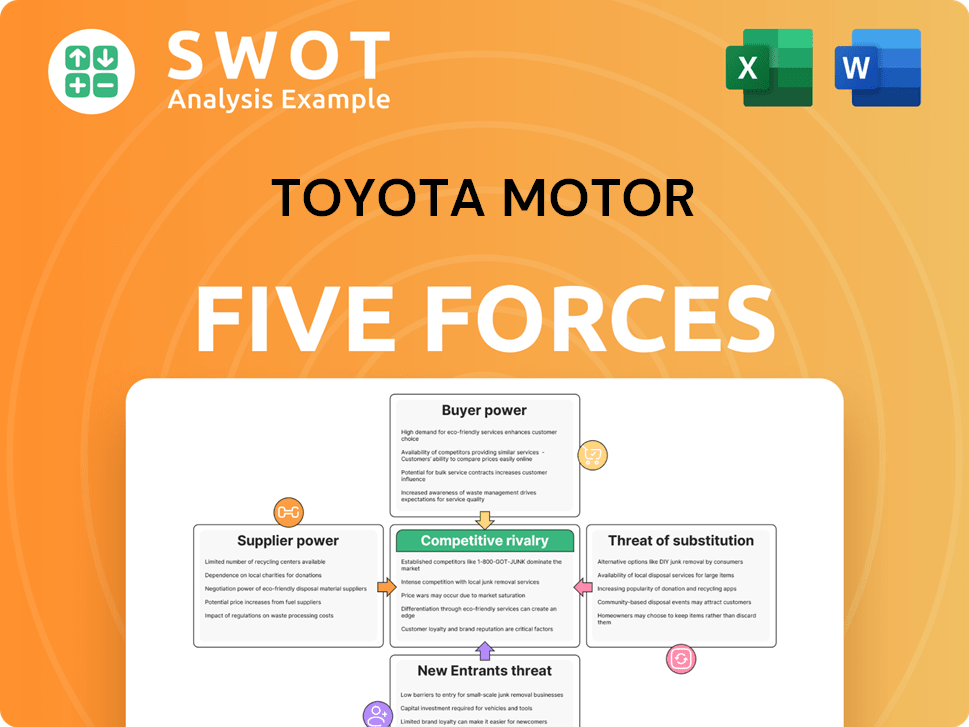
Toyota Motor Porter's Five Forces Analysis
Fully Editable
Tailor To Your Needs In Excel Or Sheets
Professional Design
Trusted, Industry-Standard Templates
Pre-Built
For Quick And Efficient Use
No Expertise Is Needed
Easy To Follow
Toyota Motor Bundle
What is included in the product
Analyzes Toyota's competitive landscape by exploring threats from rivals, buyers, and suppliers.
Instantly identify risks: see where Toyota faces intense pressure and where they can gain an edge.
Same Document Delivered
Toyota Motor Porter's Five Forces Analysis
You're looking at the actual document. This Toyota Motor Porter's Five Forces analysis meticulously examines industry rivalry, supplier power, buyer power, the threat of new entrants, and the threat of substitutes. The preview provides a comprehensive view of Toyota's competitive landscape, including insights into market dynamics and strategic implications. This detailed assessment is fully formatted and ready for your immediate use upon purchase.

Porter's Five Forces Analysis Template
From Overview to Strategy Blueprint
Toyota Motor's industry faces complex forces. Buyer power is moderated by brand loyalty and vehicle customization. Supplier power is influenced by global component sourcing. The threat of new entrants is high due to substantial capital needs and existing market players. Substitute threats stem from evolving mobility solutions. Competitive rivalry among established automakers remains intense.
Our full Porter's Five Forces report goes deeper—offering a data-driven framework to understand Toyota Motor's real business risks and market opportunities.
Suppliers Bargaining Power
Supplier Concentration
Toyota's extensive network, involving approximately 60,000 suppliers, significantly dilutes supplier power. The company's strategy includes direct negotiations with about 400 Tier 1 suppliers. This approach, combined with relationships that extend to Tier 2 and beyond, ensures a diversified supply base. This limits the impact of any single supplier on Toyota's operations and profitability.
Long-Term Partnerships
Toyota's bargaining power of suppliers is moderate. Toyota builds enduring ties with suppliers, centered on trust and cooperation. The average supplier relationship spans roughly 15 years, as of 2024. This longevity fortifies the supply chain and lessens the likelihood of suppliers moving to rivals.

Vertical Integration
Toyota’s vertical integration, including its stake in Denso Corporation, significantly impacts its supplier bargaining power. This strategy reduces dependence on external suppliers, offering more control over the supply chain. In 2023, Toyota’s vertical integration efforts cut external purchasing costs by 17.3%. This approach strengthens Toyota's ability to negotiate favorable terms.
Just-in-Time (JIT) System
Toyota's Just-in-Time (JIT) system significantly impacts supplier bargaining power. JIT ensures materials arrive precisely when needed, minimizing inventory. This reduces Toyota's reliance on large stockpiles, decreasing supplier leverage. Toyota's 2024 revenue reached $305.7 billion, showcasing the system's efficiency.
- JIT minimizes inventory holding costs.
- Toyota's strong negotiating position.
- Reduced supplier influence on pricing.
- Efficient supply chain management.
Geographic Diversification
Toyota's geographic diversification significantly impacts supplier bargaining power. The company's sourcing strategy spans across 42 countries, reducing dependency on any single region. This approach minimizes vulnerability to localized issues like natural disasters or political instability.
- No single country represents over 22% of Toyota's supplier base.
- This diversification enhances supply chain resilience.
- It limits suppliers' ability to dictate terms.
- Toyota's global presence strengthens its negotiation position.
Toyota's Supplier Strategy: Control and Cost Reduction
Toyota's expansive supplier network, encompassing around 60,000 entities, and its long-term partnerships, averaging 15 years as of 2024, diminish supplier influence. Vertical integration, exemplified by its stake in Denso, and its Just-in-Time system further enhance control. Geographic diversification across 42 countries strengthens resilience, limiting supplier leverage and improving negotiation terms, as evidenced by a 17.3% reduction in external purchasing costs in 2023.
| Aspect | Details | Impact |
|---|---|---|
| Supplier Network | ~60,000 suppliers | Reduces individual supplier power |
| Avg. Supplier Relationship | ~15 years (2024) | Builds strong ties, limits supplier switching |
| Vertical Integration | Stake in Denso Corp. | Increases control over supply chain |
Customers Bargaining Power
Price Sensitivity
Customers' price sensitivity significantly boosts their bargaining power in the automotive sector. With numerous vehicle options available across diverse segments, consumers have ample choices. Information accessibility allows for easy price and feature comparisons. In 2024, the average transaction price for a new car in the US was around $48,000, highlighting price's impact.
Availability of Choices
Customers wield considerable power due to the vast automotive market. Toyota, in 2024, has 11 models with 37 configurations. This abundance of choices, including options from competitors, allows customers to easily switch brands. This dynamic keeps Toyota responsive to consumer needs.

Strong Brand Loyalty
Toyota's strong brand loyalty significantly impacts customer bargaining power. In 2023, Toyota's brand loyalty hit 61.2%, surpassing the 54.7% industry average. This high loyalty rate reduces customers' ability to negotiate prices. It also gives Toyota an edge in retaining customers.
Demand for Hybrids/EVs
Customer demand for electric and hybrid vehicles significantly influences Toyota's market position. Toyota's 2023 global sales included 2.1 million hybrid and electric vehicles, accounting for 35.6% of total sales volume. This shift in consumer preference necessitates that Toyota effectively manages its production and supply chains to satisfy customer needs and maintain its market share. Meeting demand is crucial for customer satisfaction.
- 2.1 million hybrid/EV sales globally in 2023.
- 35.6% of total sales volume in 2023.
- Customer preferences are shifting towards EVs/Hybrids.
- Toyota must adapt to meet rising demand.
Low Switching Costs
Low buyer switching costs significantly amplify customer power, enabling them to effortlessly switch to alternative brands. This ease of movement forces Toyota to consistently provide superior value and meet customer demands to maintain its market share. With numerous automotive options available, Toyota faces intense pressure to offer competitive pricing and features. According to 2024 data, the average customer loyalty rate in the automotive industry is around 40%, underscoring the importance of customer retention.
- Easy switching allows customers to choose competitors.
- Toyota must excel in value to retain customers.
- Competitive pricing and features are essential.
- Industry customer loyalty averages around 40% in 2024.
Auto Industry: Customer Power Dynamics
Customer bargaining power in the auto industry is strong due to price sensitivity and numerous choices. High brand loyalty, like Toyota's 61.2% in 2023, reduces customer influence. Demand for EVs/hybrids also affects Toyota's market position; 35.6% of its 2023 sales were EVs/hybrids.
| Factor | Impact | Data |
|---|---|---|
| Price Sensitivity | High | Avg. new car price in US ≈ $48,000 (2024) |
| Brand Loyalty | Reduces Bargaining | Toyota Loyalty 61.2% (2023) |
| EV/Hybrid Demand | Shifts Market | 35.6% of Toyota sales in 2023 |
Rivalry Among Competitors
Aggressive Automakers
The automotive industry shows high competitive rivalry, especially among aggressive automakers. This intense competition challenges Toyota's market position. Automakers differentiate cars to compete. In 2024, Toyota faced rivals like Tesla, with Tesla's market cap at $580B.
Variety and Differentiation
The automotive market features high variety and differentiation. Toyota's rivals include Volkswagen Group, Ford, and Honda. In 2024, Toyota sold approximately 10.3 million vehicles globally. Volkswagen sold around 8.3 million vehicles. Ford and Honda also have significant market shares. This rivalry drives innovation and pricing strategies.

Hybrid and EV Market Position
Toyota dominates the hybrid market, boasting a 63% global share and selling 2.1 million hybrids in 2023. However, its EV sales, at 0.3 million units, lag behind competitors. This creates intense rivalry, especially as rivals aggressively expand their EV offerings. Toyota must innovate to maintain its overall market position.
Technology Investment
Toyota's strong focus on technology investment significantly impacts competitive rivalry. The company consistently invests in research and development to stay ahead. In 2023, Toyota's R&D spending reached $9.6 billion. This investment supports advancements in autonomous driving and electric vehicle technologies, vital for future competitiveness.
- R&D Spending: $9.6 billion in 2023.
- Focus: Autonomous and electric vehicles.
- Impact: Maintains competitive edge.
Regional Competitive Variations
Competitive intensity for Toyota differs across regions. In North America, the rivalry with Ford and General Motors is strong. Europe sees tough competition from Volkswagen and Mercedes-Benz. Honda and Hyundai are key rivals in Asia. Toyota's global sales in 2023 were approximately 11.09 million vehicles.
- North America: Ford, GM.
- Europe: Volkswagen, Mercedes-Benz.
- Asia: Honda, Hyundai.
- 2023 Global Sales: 11.09 million vehicles.
Toyota's Competitive Landscape: Key Rivals and Strategies
Competitive rivalry significantly affects Toyota's market position in the automotive industry. Toyota competes with both traditional and electric vehicle manufacturers. In 2024, Tesla's market cap was at $580B, intensifying the competition. Continuous innovation and strategic investments are crucial for Toyota's success.
| Aspect | Details |
|---|---|
| Key Rivals | Tesla, Volkswagen, Ford, Honda, GM |
| 2023 R&D Spend | $9.6 billion |
| 2023 Global Sales | 11.09 million vehicles |
SSubstitutes Threaten
Electric Vehicles (EVs)
The rise of electric vehicles (EVs) poses a notable threat to Toyota. In 2022, global EV sales hit 10.5 million units. The EV market is expected to reach $957.4 billion by 2028. This shift could decrease the demand for Toyota's traditional combustion engine vehicles. Toyota must adapt to maintain its market position.
Ride-Sharing Services
Ride-sharing services like Uber and Lyft pose a threat to Toyota's sales. Car-sharing services offer alternatives to owning a vehicle. The global ride-sharing market was worth $218.3 billion in 2022. These services can decrease demand for personal vehicles. This shift impacts Toyota's market share.

Micro-Mobility Options
Emerging micro-mobility options, like e-scooters and e-bikes, pose a threat. The global micro-mobility market reached $40.1 billion in 2022. These alternatives offer convenient short-distance travel solutions. Urban areas could see reduced demand for traditional vehicles. This shift impacts companies like Toyota.
Public Transportation
Public transportation presents a substitute threat to Toyota's vehicle sales, especially in urban areas. Well-developed public transit, including buses and subways, offers an alternative to personal vehicles. In 2023, U.S. bus systems carried approximately 22.6 billion passengers. Metro/subway systems transported about 15.3 billion passengers annually, influencing car ownership decisions.
- Bus systems transported 22.6 billion passengers annually.
- Metro/subway systems transported 15.3 billion passengers annually.
Work-From-Home
The shift to work-from-home (WFH) arrangements poses a notable threat to Toyota, as it diminishes the necessity for daily commutes and, consequently, the demand for personal vehicles. This trend is supported by data indicating a sustained increase in remote work, with a significant percentage of the workforce now operating remotely. For instance, in 2024, approximately 30% of the U.S. workforce was working remotely. This shift impacts Toyota's sales, particularly in urban areas where commuting was a primary driver of car purchases.
- Reduced Commuting: WFH decreases the need for daily travel, lowering vehicle demand.
- Shifting Preferences: Consumers may prioritize other expenses over vehicle ownership.
- Market Impact: Reduced vehicle sales affect revenue and market share.
Toyota's Shifting Landscape: Facing New Mobility Rivals
Toyota faces substitution threats from EVs, ride-sharing, and micro-mobility options. The global EV market is projected to reach $957.4 billion by 2028, potentially impacting Toyota's combustion engine vehicle sales. Public transport, used by billions annually, further reduces car demand. Remote work arrangements also contribute to this trend.
| Substitute | Impact | 2024 Data |
|---|---|---|
| EVs | Reduced ICE sales | EV sales continue to rise, with new models entering the market. |
| Ride-sharing | Lower personal vehicle demand | Market size remains significant, impacting car ownership choices. |
| Public Transit | Decreased car usage | U.S. public transport use remains substantial, with billions of annual riders. |
Entrants Threaten
High Capital Requirements
High capital requirements pose a major hurdle for new automotive entrants. Manufacturing vehicles demands huge upfront investments, effectively blocking many potential competitors. Starting an automotive manufacturing plant can cost from $500 million to $1 billion. Toyota's capital expenditure was $10.4 billion in 2023, highlighting the scale of investment needed.
Technological Barriers
Technological barriers significantly impact the threat of new entrants in the automotive industry. Developing advanced electric vehicle and autonomous driving technologies requires substantial investment. For example, the development of electric vehicle battery technology can cost between $500 million and $1.2 billion. Investment in autonomous driving tech ranges from $750 million to $1.5 billion. These high costs create a considerable barrier to entry.

Established Brand Reputation
Established brands like Toyota pose a formidable challenge to new entrants. Toyota's brand value hit $59.5 billion in 2023, reflecting strong consumer trust. With a 10.5% global market share, Toyota demonstrates its dominance. High customer loyalty, at 62%, further solidifies its market position, hindering new competitors.
Regulatory Environment
New automotive manufacturers face significant hurdles from regulatory environments. Stringent regulations and compliance costs are major barriers to entry. The automotive industry's high level of regulation demands substantial investment and expertise, making it difficult for new companies to compete. Complying with emission standards, safety protocols, and other requirements is expensive. In 2024, the average cost to comply with these regulations in the United States was estimated at $200 million.
- Compliance costs can include expenses for testing, certification, and legal fees.
- Regulations vary by region, adding complexity for global manufacturers.
- Smaller firms often struggle to manage these overheads compared to established giants.
- Failure to meet standards can result in hefty fines and production delays.
Economies of Scale
Existing automakers like Toyota benefit significantly from economies of scale, making it challenging for new entrants to compete on cost. This advantage allows established companies to spread fixed costs over a massive production volume, driving down the average cost per unit. Economies of scale strengthen a company's competitive advantage, creating a barrier to entry. For example, in 2024, Toyota's global production reached approximately 9 million vehicles, showcasing its scale.
- High production volumes lower per-unit costs.
- Established brands have a cost advantage.
- New entrants face cost disadvantages.
- Toyota's global presence exemplifies scale.
Toyota's Fortress: Entry Barriers Examined
The threat of new entrants for Toyota is moderate due to substantial barriers. High capital investments, such as Toyota's $10.4 billion capex in 2023, restrict entry. Technological demands, like EV battery tech costing up to $1.2 billion, are another hurdle.
Strong brand equity, with Toyota's $59.5 billion brand value, and customer loyalty (62%) further protect its market share. Regulatory compliance, with average 2024 costs of $200 million, adds complexity. Economies of scale, exemplified by 9 million vehicles produced in 2024, solidify Toyota's advantage.
| Barrier | Impact | Example (Toyota) |
|---|---|---|
| Capital Requirements | High Investment Needed | $10.4B Capex (2023) |
| Technology | Costly Development | EV Battery: Up to $1.2B |
| Brand & Loyalty | Established Dominance | $59.5B Brand Value |
Porter's Five Forces Analysis Data Sources
This analysis is built using annual reports, industry publications, and market research data to assess Toyota's competitive landscape. Data also comes from regulatory filings.
