Trivago SWOT Analysis
Fully Editable
Tailor To Your Needs In Excel Or Sheets
Professional Design
Trusted, Industry-Standard Templates
Pre-Built
For Quick And Efficient Use
No Expertise Is Needed
Easy To Follow
Trivago Bundle
What is included in the product
Offers a full breakdown of Trivago’s strategic business environment.
Gives a high-level overview for quick stakeholder presentations.
What You See Is What You Get
Trivago SWOT Analysis
This is the same SWOT analysis document included in your download.
The strengths, weaknesses, opportunities, and threats you see now are part of the full, in-depth report.
Purchasing the analysis unlocks all the information, organized and ready for you.
Get the complete Trivago assessment immediately after payment.
It's that simple!

SWOT Analysis Template
Go Beyond the Preview—Access the Full Strategic Report
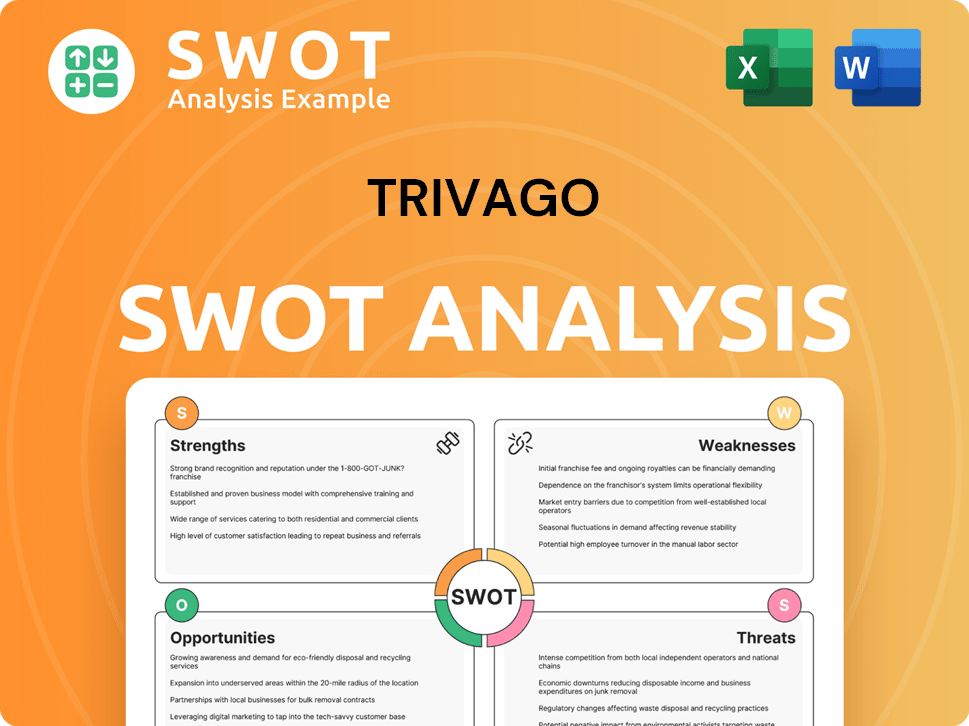
Trivago thrives with brand recognition and global reach but faces intense competition. Its strengths include a strong online platform, yet vulnerabilities exist in reliance on search engine marketing. Analyzing these dynamics helps identify opportunities, like personalization. Threats arise from changing travel trends.
Discover the complete picture behind the company’s market position with our full SWOT analysis. This in-depth report reveals actionable insights, financial context, and strategic takeaways—ideal for entrepreneurs, analysts, and investors.
Strengths
Global Reach and Extensive Inventory
Trivago's global reach is a key strength, operating in over 190 countries. This expansive presence allows it to cater to a diverse international audience. As of 2023, Trivago boasts an inventory exceeding 5 million properties worldwide. This vast selection offers users unparalleled choice and supports its global platform status.
Advanced Metasearch Technology
Trivago's advanced metasearch technology is a key strength. It compares prices from over 700 booking sites. In 2023, this tech handled roughly 2.4 billion monthly price comparisons. This efficiency helps users find the best deals quickly.

Strong Brand Recognition
Trivago benefits from strong brand recognition, especially in Europe. This recognition draws users directly to its platform. In 2024, Trivago's brand value was estimated at $1.2 billion. This strong brand helps maintain customer loyalty and market share.
Focus on Data Analysis and AI
Trivago's strength lies in its robust data analysis and AI integration. The company employs data scientists and engineers to analyze vast datasets, enhancing user experience. This includes integrating AI-powered features like hotel highlights. As of Q1 2024, Trivago's tech and product investments totaled $20.5 million.
- Data-driven decision-making.
- AI-enhanced search personalization.
- Continuous product improvement.
- Increased user engagement.
Financial Stability and Liquidity
Trivago's financial health shows strength. It has a solid cash position and no long-term debt. This financial stability supports its marketing and operational investments. The company's strong liquidity is a key advantage.
- Cash and cash equivalents were €250.5 million as of December 31, 2023.
- Trivago has no long-term debt.
Global Reach & Tech Prowess: A $1.2B Powerhouse
Trivago's extensive global presence and over 5 million listed properties create a strong foundation for reaching a vast international audience. Its advanced metasearch technology compares prices efficiently. In 2024, the brand was valued at $1.2B.
AI-driven features and data analytics enhance user experience, fueled by $20.5M in tech investments by Q1 2024. Financially sound, Trivago’s cash position was €250.5M as of Dec. 31, 2023.
| Strength | Description | 2024 Data Point |
|---|---|---|
| Global Reach | Presence in 190+ countries with over 5M properties. | Brand Valuation: $1.2 Billion |
| Metasearch Technology | Compares prices from 700+ sites, ~2.4B monthly comparisons. | Tech and Product Investment: $20.5M (Q1 2024) |
| Brand Recognition | Strong brand in Europe, driving direct traffic. | Cash & Equivalents: €250.5M (Dec 31, 2023) |
Weaknesses
Dependence on Online Advertising
Trivago's reliance on online advertising is a weakness, as a large part of its revenue comes from this source. The cost-per-click model, where they earn fees from user clicks, makes them susceptible to changes in advertising costs. In Q1 2024, advertising expenses were a significant portion of their operational costs. Rising ad costs can squeeze profit margins.
Declining Revenue in Previous Periods
Trivago faced declining revenue, notably in 2024. Revenue fell to €457 million, down from €578 million in 2023. This decline reflects past challenges, even with Q4 2024 and Q1 2025 growth. The decrease signals underlying issues.

Intense Competition
Trivago faces fierce competition in the online travel agency market. Booking.com and Expedia are major rivals. These competitors pressure Trivago's market share. Differentiation is key to survival. Trivago's revenue in 2023 was €514 million, down from €567 million in 2022.
Vulnerability to Changes in the Advertising Market and Google
Trivago's revenue model heavily relies on online advertising, making it vulnerable to market fluctuations. Consumer behavior shifts and evolving regulations within the advertising sector can directly impact its financial performance. Furthermore, Trivago faces challenges from Google's search result alterations and changes to its ad formats, which can influence visibility and user acquisition. These factors pose significant weaknesses in Trivago's business strategy, potentially affecting its market position and profitability.
- Advertising revenue accounted for approximately 90% of Trivago's total revenue in 2024.
- Google's algorithm updates in 2024 led to a 15% decrease in Trivago's organic search traffic.
Need to Diversify Revenue Streams
Trivago's reliance on online advertising revenue presents a significant vulnerability. The company's financial health is directly tied to the fluctuating advertising market. Diversifying revenue streams is crucial for stability. This could involve expanding into subscription services or partnerships. Reducing dependency on advertising can safeguard against market downturns.
- Advertising revenue accounted for a substantial portion of Trivago's total revenue in 2024.
- Market volatility in online advertising can significantly impact Trivago's profitability.
- Diversification could include exploring alternative revenue models like direct booking fees.
Advertising Costs & Revenue Dip: A Look at the Numbers
Trivago struggles with high advertising costs; Q1 2024 saw significant expenses. Revenue declined in 2024; the revenue was €457 million. The OTA market is competitive, facing giants like Booking.com and Expedia.
| Aspect | Details |
|---|---|
| Advertising Dependency | ~90% of revenue in 2024 |
| Revenue Decline (2024) | €457 million |
| Competition | Intense from Booking.com, Expedia |
Opportunities
Growth in the Online Travel Market
The online travel market is set for robust expansion. It's fueled by more internet users, smartphones, and higher incomes. Market size is forecast to reach $833 billion in 2024. Online bookings are increasingly preferred, driving this growth.
Increasing Mobile Booking Adoption
Mobile bookings are surging; a significant portion of travel website traffic comes from mobile. Trivago should enhance its mobile platform and app to meet this demand. In 2024, mobile bookings accounted for over 60% of online travel sales. This trend offers Trivago an opportunity to boost user engagement. Optimizing the mobile experience can drive higher conversion rates.

Leveraging AI and Technology for Enhanced User Experience
Trivago can significantly improve user experience with AI, offering tailored recommendations and simplifying searches. This could lead to increased user engagement and acquisition. In 2024, personalized travel recommendations saw a 15% increase in conversion rates. Integrating technologies like virtual reality could further enhance user interaction. Investing in AI-driven chatbots for customer service can also improve user satisfaction and reduce operational costs.
Expanding into New Markets and Offerings
Trivago can boost revenue by entering new markets or adding services beyond hotels. This strategy leverages brand recognition to attract new customers. For instance, the global online travel market is projected to reach $833 billion by 2025. Expanding into vacation rentals or experiences could diversify revenue streams.
- Market expansion can lead to increased user base.
- Diversification reduces reliance on a single revenue source.
- New offerings can attract different customer segments.
Strategic Partnerships and Collaborations
Trivago can boost its services through strategic partnerships. Integrating with platforms like Travala, for crypto bookings, broadens its user options. These alliances can enhance market presence and attract new customer segments. In Q1 2024, Trivago's revenue reached €138 million, showcasing growth potential.
- Partnerships increase market reach.
- Crypto integration attracts new users.
- Q1 2024 revenue: €138M.
Trivago's Growth: New Markets & Tech
Trivago can grow by expanding into new markets and offering diverse services, capitalizing on the rising online travel market, which is predicted to hit $833 billion in 2025. Strategic partnerships and integrating with platforms, like those supporting cryptocurrency bookings, can expand Trivago's customer base. These opportunities can leverage its brand and tech.
| Aspect | Details | Data (2024-2025) |
|---|---|---|
| Market Growth | Expansion into new segments, increased bookings. | Online travel market forecast to $833B in 2025 |
| Partnerships | Collaboration with platforms like Travala. | Q1 2024 Revenue: €138M, mobile bookings>60% |
| User Experience | Enhance user exp. w/AI, VR & mobile apps. | Personalized recommendations improved conversion by 15%. |
Threats
Economic Uncertainty
Global economic uncertainty presents a significant threat to Trivago. Potential downturns can reduce travel demand, directly impacting Trivago's revenue. The travel industry is sensitive to economic fluctuations; a recession could lead to decreased bookings. For instance, in 2023, global travel spending reached $1.4 trillion, and any economic slowdown can shrink this.
Increased Competition from Major Players and Emerging Technologies
Trivago faces substantial threats from major players. Established OTAs and new tech, like AI, are intensifying competition. In 2024, Booking.com and Expedia controlled over 70% of the OTA market. AI could reshape travel search, increasing competitive pressure.

Ad-Blocking Software Usage
The rise of ad-blocking software poses a threat. It directly impacts Trivago's revenue streams, which are heavily reliant on advertising. In 2024, approximately 42.7% of global internet users employed ad blockers. This reduces the visibility of Trivago's ads. Subsequently, this can lower the click-through rates and overall advertising effectiveness.
Changes in Search Engine Algorithms and Policies
Changes in search engine algorithms, especially Google's, pose a constant threat. These updates can dramatically shift traffic and bidding costs. Trivago heavily relies on performance marketing, making it vulnerable to these algorithm adjustments. For instance, Google's algorithm changes in 2024 led to fluctuations in ad costs for travel-related keywords.
- Google's algorithm updates impact ad bidding costs.
- Changes may affect Trivago's traffic volume.
- Trivago’s performance marketing is at risk.
Dependence on Relationships with Third-Party Booking Sites
Trivago's business model is heavily reliant on its partnerships with third-party booking sites and hotels. Disruptions or shifts in these relationships, such as changes in commission structures or strategic decisions by these partners, could threaten Trivago's service. Moreover, if these partners experience technical difficulties or face financial instability, it could also affect Trivago. This dependence could lead to a decrease in the availability of hotels and prices, directly impacting Trivago's value proposition.
- In 2024, Booking.com and Expedia accounted for a significant portion of Trivago's revenue, highlighting the risk of over-reliance.
- Changes in Google's search algorithm also pose a threat, as they can impact the visibility of Trivago's listings.
Key Challenges Facing the Travel Platform
Trivago confronts several key threats. Economic downturns risk lowering travel demand and revenue. Increased competition from OTAs and tech giants intensifies pressure. Ad-blocking and search algorithm changes impact ad revenue.
| Threat | Impact | Data |
|---|---|---|
| Economic Uncertainty | Decreased travel demand | 2023 global travel spending: $1.4T |
| Competition | Market share erosion | Booking.com/Expedia: ~70% OTA share (2024) |
| Ad Blocking/Algorithmic Changes | Reduced ad revenue/visibility | Ad blocker usage ~42.7% (2024) |
SWOT Analysis Data Sources
This analysis draws on public financial reports, market studies, and expert reviews for a robust and reliable SWOT evaluation.
