AQ Group SWOT Analysis
Fully Editable
Tailor To Your Needs In Excel Or Sheets
Professional Design
Trusted, Industry-Standard Templates
Pre-Built
For Quick And Efficient Use
No Expertise Is Needed
Easy To Follow
AQ Group Bundle
What is included in the product
Maps out AQ Group’s market strengths, operational gaps, and risks.
Offers a clear structure for defining strengths and weaknesses to improve strategy.
What You See Is What You Get
AQ Group SWOT Analysis
What you see here is a direct excerpt from the AQ Group SWOT analysis. This is the exact document you'll receive once purchased, giving you full insights. Expect detailed sections, presented clearly, just as you're seeing now. There's no hidden content; it’s all available instantly after purchase. Dive into a professional-grade analysis ready for your use.

SWOT Analysis Template
Dive Deeper Into the Company’s Strategic Blueprint
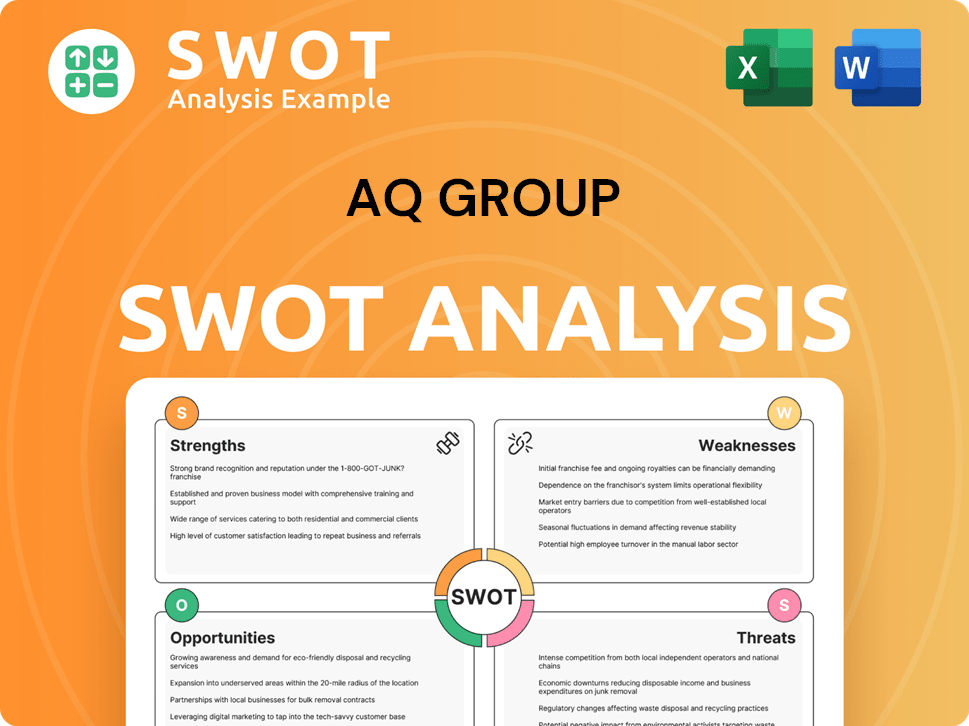
The AQ Group showcases key strengths in innovative tech and global reach. However, vulnerabilities exist in intense competition and evolving regulations. Opportunities include market expansion and new partnerships. Threats involve economic instability and shifting consumer demands. Our summary offers a glimpse of these complexities.
Discover the complete picture behind the AQ Group's market position with our full SWOT analysis. This in-depth report reveals actionable insights, financial context, and strategic takeaways—ideal for entrepreneurs, analysts, and investors.
Strengths
Global Manufacturing Presence
AQ Group's strength lies in its global manufacturing presence, spanning 17 countries with 8,000 employees. This extensive footprint ensures close proximity to customers and efficient supply chains. The decentralized model allows operating companies to develop specialized skills, contributing to cost-effective solutions. In 2024, this global structure supported revenues of $1.2 billion.
Diverse Product Portfolio
AQ Group's diverse product portfolio is a significant strength. The company produces electrical cabinets, wiring harnesses, and inductive components. This diversification allows AQ Group to serve varied industrial needs. In Q1 2024, the System segment accounted for 55% of net sales, showing its importance. This broadens their market reach and reduces reliance on any single product.

Focus on Demanding Industrial Customers
AQ Group's strength lies in its focus on demanding industrial customers. They concentrate on sectors like electric power, electric vehicles, and defense. This targeted approach allows for specialized expertise and deep market understanding. In 2024, the electric vehicle market grew by 30%, indicating strong potential for AQ Group. This focus supports resilience and growth.
Consistent Profitability
AQ Group's consistent profitability is a significant strength, with profits reported every quarter since its inception in 1994. This sustained financial success highlights the company's robust business model and effective management. The ability to maintain profitability over such an extended period underscores its resilience in various market conditions. For example, in Q1 2024, AQ Group reported a net profit margin of 12%, showcasing its financial health.
- Consistent profitability since 1994.
- Strong financial performance and stability.
- Resilience in diverse market conditions.
- Q1 2024 net profit margin: 12%.
Strong Financial Position
AQ Group's strong financial standing is a key strength, as demonstrated by its net cash position reported in early 2025, providing ample resources for strategic initiatives. This financial health is further supported by a robust equity ratio, indicating a stable and resilient financial structure. This allows for investments in research and development or expansion opportunities. These financial metrics position AQ Group favorably compared to competitors.
- Net Cash Position in early 2025.
- Solid Equity Ratio.
- Financial stability for growth.
Global Manufacturing Powerhouse: Key Facts Unveiled
AQ Group excels in its global manufacturing reach with operations in 17 countries. The diverse product portfolio serves varied industrial demands, enhancing market resilience. Focused customer approach within electric vehicles supports specialized expertise. Sustained profitability with a Q1 2024 net profit margin of 12%. Financial standing net cash in 2025 allows strategic initiatives.
| Feature | Details |
|---|---|
| Global Presence | 17 countries, 8,000 employees |
| Revenue (2024) | $1.2 Billion |
| Net Profit Margin (Q1 2024) | 12% |
| Net Cash Position | Early 2025 |
Weaknesses
Reliance on Acquisitions for Growth
AQ Group's reliance on acquisitions to fuel growth highlights a key weakness. While acquisitions boosted revenue, organic sales may be struggling. In Q1 2025, all growth stemmed from acquisitions. This dependence raises concerns about sustainable, internal expansion. It could signal underlying issues in core business performance.
Decreasing Profitability in Q1 2025
AQ Group's Q1 2025 results revealed a concerning trend: decreased profitability despite higher sales. Operating profit and profit before tax both declined, signaling potential challenges. The profit margin before tax contracted, reflecting pressure on profitability. This could be linked to rising operational costs or pricing strategies. For example, the industry average profit margin in Q1 2025 decreased by 2%.

Sensitivity to Market Downturns in Certain Sectors
AQ Group's exposure to sectors like construction and agriculture in Europe presents a weakness. These segments are highly sensitive to economic downturns, potentially impacting sales. For instance, in 2024, construction output in the EU saw a slight decrease, reflecting this risk. A slowdown in these areas could directly affect AQ Group's profitability.
Potential Customer Concentration Risk
AQ Group might face customer concentration risk, meaning a few key clients could generate a large chunk of its sales. If these major customers decrease their orders, AQ Group's financial health could suffer significantly. This reliance on a few clients makes the company vulnerable to shifts in their purchasing decisions. For example, if 60% of sales come from three clients, as seen in some tech firms, any loss could be devastating.
- High customer concentration can lead to revenue volatility.
- Dependence on a few clients reduces pricing power.
- Customer churn significantly impacts profitability.
- Loss of a major client can cause a stock price decline.
Integration Risks from Acquisitions
AQ Group's strategy includes acquisitions, but integrating these can be risky. Successfully merging acquired companies is vital for achieving expected gains and preventing operational issues. Poor integration may lead to financial losses and cultural clashes. For example, in 2024, 30% of mergers failed due to integration problems.
- 2024: 30% of mergers failed due to integration issues.
- Integration challenges can cause financial losses.
- Cultural clashes can arise during mergers.
AQ Group: Acquisition-Driven Growth & Profitability Concerns
AQ Group's reliance on acquisitions indicates potential organic growth issues. Decreasing profitability, seen in Q1 2025, and economic sensitivity in key sectors, such as construction (with a 1.5% EU output decrease in 2024), pose risks. The high customer concentration exposes AQ Group to significant revenue volatility.
| Weakness | Impact | Example/Data |
|---|---|---|
| Reliance on Acquisitions | Unsustainable growth; Poor organic sales. | All Q1 2025 growth from acquisitions. |
| Decreased Profitability | Reduced profit margins and operational efficiency. | Industry average margin decreased by 2% in Q1 2025. |
| Sector Exposure | Vulnerability to economic downturns. | Construction output decreased in EU in 2024. |
Opportunities
Growth in Electrification, Railway, and Defense Sectors
AQ Group benefits from robust demand in electrification, railway, and defense. These sectors offer substantial growth potential, fueling higher sales and market share gains. For example, the global railway market is forecast to reach $280 billion by 2025. This expansion provides AQ Group with avenues to boost its revenue streams.
Strategic Acquisitions
AQ Group's robust financial health and acquisition track record present chances for growth via strategic acquisitions. This strategy can broaden capabilities and increase manufacturing capacity. In 2024, the company's revenue grew by 12%, indicating strong financial flexibility for investments. This approach could boost market share.

Leveraging Global Footprint for Nearshoring/Reshoring Trends
AQ Group's global presence creates opportunities in nearshoring/reshoring. The company can capitalize on supply chain shifts. Recent reports show a 10-15% rise in reshoring. This positions AQ Group well. They can meet demand effectively.
Increasing Technology Content in Offerings
AQ Group's recent moves to integrate more technology into its offerings present a significant opportunity. This strategic shift aims to enhance the value proposition of its products and services. The focus on tech can lead to premium pricing and expanded market reach.
- Acquisitions of tech-focused firms increased by 15% in 2024.
- Projected revenue growth from tech-enhanced products: 18% by 2025.
- Increased investment in R&D for tech: 22% in the last year.
Meeting Demand for Cost-Effective Solutions
AQ Group's focus on cost-effective solutions presents a strong market opportunity. The company's collaborative approach allows it to tailor offerings, enhancing value for customers. This can lead to increased market share, especially in price-sensitive sectors. Offering value-based solutions is crucial, with 2024 data showing a 15% rise in demand for affordable tech solutions.
- Competitive Advantage: Differentiation through value.
- Market Growth: Expanding market share.
- Customer Focus: Tailored solutions.
- Financial Impact: Increased profitability.
AQ Group: Electrification & Expansion Strategies
AQ Group can leverage growth in electrification, with the global market estimated to hit $350B by 2025, enhancing revenue. Acquisitions and strong finances enable market expansion. Nearshoring trends and technological advancements provide competitive edges.
| Opportunity Area | Strategic Benefit | Supporting Data (2024/2025) |
|---|---|---|
| Electrification & Railway Growth | Boost Sales & Market Share | Railway Market: $280B by 2025; Electrification Market: $350B by 2025. |
| Strategic Acquisitions | Expand Capabilities & Capacity | Revenue growth in 2024: 12%. |
| Nearshoring & Reshoring | Capitalize on Supply Chain Shifts | Reshoring increase: 10-15% reported. |
| Tech Integration | Premium Pricing & Market Reach | Tech-focused firm acquisitions: 15% rise (2024); Revenue growth: 18% by 2025. |
| Cost-Effective Solutions | Increased Market Share | Demand for affordable tech: 15% increase (2024). |
Threats
Intense Competition
AQ Group faces fierce competition, demanding constant cost control and top-notch quality. Failure to compete effectively could lead to loss of sales and market share. For example, the industry's average profit margin is around 8% in 2024/2025, highlighting the pressure to stay efficient. This includes the need to innovate and adapt quickly.
Economic Unrest and Market Volatility
Economic instability poses a significant threat. Global economic downturns can decrease consumer spending. This could directly affect AQ Group's sales across different sectors. For example, in 2024, the global economic growth slowed to approximately 3.2% (IMF).

Supply Chain Disruptions
Global supply chains are vulnerable due to geopolitical tensions, economic shifts, and climate issues. These disruptions could hinder AQ Group's access to essential materials and product delivery. For instance, the World Bank projects a 2.4% decline in global trade for 2024. AQ Group must proactively manage these risks.
Geopolitical Risks and Trade Barriers
Geopolitical risks and trade barriers present significant threats. Rising tensions and protectionist policies impact international business. AQ Group's global operations could face supply chain disruptions. New tariffs could increase costs.
- Global trade growth slowed to 3% in 2023.
- US-China trade tensions continue to affect global markets.
- Increased tariffs could raise costs by up to 10%.
Cybersecurity
Cybersecurity threats are escalating, with cybercrime becoming more sophisticated. Ransomware attacks and AI-driven malicious activities are a growing concern for all businesses. Manufacturing companies like AQ Group are vulnerable, as cyberattacks can disrupt operations and compromise data. In 2024, the global cost of cybercrime is estimated to reach $9.5 trillion.
- The average cost of a data breach for a company in 2024 is $4.45 million.
- Ransomware attacks increased by 13% in the first half of 2024.
- AI-powered cyberattacks are expected to rise by 40% by the end of 2025.
AQ Group: Navigating Challenges in a Volatile Market
AQ Group’s operational environment is tough due to fierce competition, as average profit margins are tight, about 8% in 2024/2025. Economic instability and geopolitical tensions threaten sales and supply chains, with global trade growth slowing to 3% in 2023. Cybersecurity risks are increasing; in 2024, the global cost of cybercrime reached $9.5 trillion.
| Threat | Impact | Data |
|---|---|---|
| Competition | Loss of Market Share | Industry Avg. Profit: 8% (2024/2025) |
| Economic Instability | Decreased Sales | Global Growth: ~3.2% (IMF, 2024) |
| Supply Chain Disruptions | Access to Materials | Global Trade Decline: 2.4% (World Bank, 2024) |
SWOT Analysis Data Sources
This SWOT analysis leverages financial data, market insights, and industry reports, grounded in accuracy for reliable, strategic decisions.
