Chart Industries Marketing Mix
Fully Editable
Tailor To Your Needs In Excel Or Sheets
Professional Design
Trusted, Industry-Standard Templates
Pre-Built
For Quick And Efficient Use
No Expertise Is Needed
Easy To Follow
Chart Industries Bundle
What is included in the product
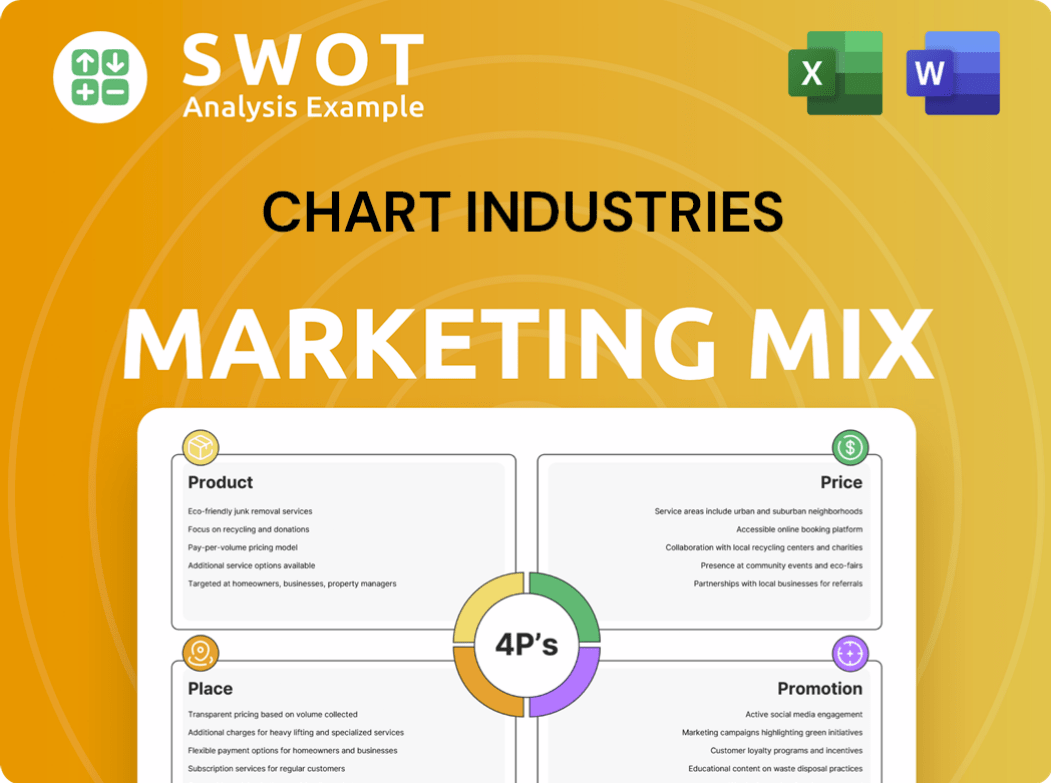
A detailed examination of Chart Industries' marketing mix: Product, Price, Place, and Promotion strategies.
Summarizes the 4Ps for fast, clear communication of Chart Industries' strategy.
What You Preview Is What You Download
Chart Industries 4P's Marketing Mix Analysis
This is the complete 4P's Marketing Mix analysis for Chart Industries. The document displayed is exactly what you will receive after purchase.

4P's Marketing Mix Analysis Template
Built for Strategy. Ready in Minutes.
Chart Industries excels in cryogenic equipment, but how do their marketing strategies fuel this success? Their product strategy focuses on innovation and quality, catering to diverse industries. They employ a value-based pricing model considering technology and market demands.
Distribution happens globally, emphasizing direct sales and partnerships for reach. Promotions blend trade shows, digital marketing, and targeted campaigns for visibility.
Want to understand how Chart Industries weaves the 4Ps for impact? The full analysis unveils the specifics of their market position and much more!
The complete 4Ps Marketing Mix gives you a deep dive! Explore what makes them effective and use it to accelerate your marketing insights.
Product
Engineered Equipment for Gas and Liquid Molecule Handling
Chart Industries excels in engineered equipment for gas and liquid molecule handling. They design and manufacture solutions for the entire liquid gas supply chain. Key applications include clean energy and industrial gas. In 2024, revenue reached $3.6 billion, reflecting strong demand.
Cryogenic s and Systems
Chart Industries' product strategy heavily features cryogenic equipment. This involves tanks and systems for storing and distributing liquefied gases. These gases include LNG, hydrogen, oxygen, and nitrogen. In 2024, Chart reported $3.4 billion in revenue, with a strong emphasis on cryogenic solutions. Their focus aligns with growing demand for clean energy.

Heat Transfer Systems
Chart Industries' heat transfer systems are a key part of its product offerings, focusing on energy efficiency. These systems are vital for operational reliability across industries. In 2024, Chart's revenue was approximately $3.6 billion, reflecting the importance of its heat transfer tech.
Repair, Service, and Leasing (Aftermarket)
Chart Industries' aftermarket services, including repair, service, and leasing, extend beyond product sales. This segment provides crucial ongoing support, ensuring customer equipment operates efficiently. It also generates consistent revenue streams for the company. These services are essential for customer retention and long-term profitability. In 2024, aftermarket services accounted for a significant portion of Chart's revenue.
- Aftermarket revenue contributes significantly to overall revenue.
- Services include repair, maintenance, and equipment leasing.
- Focus on customer retention and long-term profitability.
Solutions for the Nexus of Clean™
Chart Industries positions its products at the heart of the 'Nexus of Clean,' targeting clean power, water, food, and industrial sectors. This strategy focuses on solutions for carbon capture, hydrogen, biogas, and water treatment. This commitment aligns with growing demands for sustainable technologies, creating opportunities for growth. Chart's revenue in 2024 was approximately $3.4 billion, reflecting its strong market position.
- Carbon capture: projected to reach $6.4 billion by 2027.
- Hydrogen: market expected to reach $130 billion by 2030.
- Biogas: global market size was valued at $40.6 billion in 2023.
$3.6B Revenue: A Look at the Company's Strategy
Chart Industries' product strategy centers on cryogenic equipment, heat transfer tech, and aftermarket services. They offer complete solutions from LNG to hydrogen storage and carbon capture. Revenue for 2024 reached $3.6 billion, showcasing solid growth across various sectors.
| Product Segment | Description | 2024 Revenue |
|---|---|---|
| Cryogenic Equipment | Tanks and systems for liquefied gases like LNG & Hydrogen | $3.4 billion |
| Heat Transfer Systems | Energy-efficient systems for operational reliability | $3.6 billion |
| Aftermarket Services | Repair, service, leasing | Significant contribution |
Place
Global Manufacturing Locations
Chart Industries boasts a robust global manufacturing footprint. As of December 2024, it operated 64 manufacturing locations worldwide. This extensive network supports its diverse product lines. It ensures efficient distribution and localized service.
Extensive Service Center Network
Chart Industries' extensive service center network is a key element of its Place strategy. As of the latest data, Chart operates over 50 service centers globally. This widespread presence enables Chart to offer vital localized support. It includes aftermarket services, maintenance, and prompt repair capabilities.

Direct Sales
Chart Industries' direct sales approach focuses on building strong customer relationships, especially for intricate projects and significant equipment sales. This strategy enables the company to provide customized solutions that precisely meet customer requirements. In 2024, direct sales contributed to approximately 60% of Chart's total revenue, reflecting its importance. This model allows for immediate feedback and adjustments, leading to higher customer satisfaction and repeat business. The direct interaction also facilitates a deeper understanding of customer needs, informing future product development.
Distributor Network
Chart Industries utilizes a distributor network to broaden its market presence and offer localized support. These distributors are crucial for sales and customer service across different areas. This strategy allows Chart to tap into local market knowledge and relationships. In 2024, Chart's distribution network contributed significantly to its revenue growth. For example, the company reported a 15% increase in sales through its distributors in the first quarter of 2024.
- Geographic Expansion: Distributors facilitate Chart's reach into new markets.
- Local Expertise: They provide essential knowledge of local customer needs.
- Sales Support: Distributors assist in the sales process.
- Customer Service: They offer on-the-ground support.
Strategic Partnerships
Chart Industries strategically partners to expand its market reach and customer base. These alliances serve as extra marketing channels, improving customer accessibility. For example, in 2024, Chart collaborated with Baker Hughes to advance hydrogen solutions. This partnership aims to capitalize on the growing hydrogen market, projected to reach $130 billion by 2030.
- Expands market reach.
- Enhances customer accessibility.
- Capitalizes on emerging markets.
- Drives innovation.
Global Reach and Sales Strategy Unveiled
Chart Industries' "Place" strategy leverages a global footprint with 64 manufacturing sites (Dec 2024). Over 50 service centers ensure localized support for its clients. Direct sales make up about 60% of revenues in 2024, complemented by a distributor network.
| Aspect | Details |
|---|---|
| Manufacturing Locations (Dec 2024) | 64 Worldwide |
| Service Centers | Over 50 globally |
| Direct Sales Contribution (2024) | ~60% of Revenue |
Promotion
Trade Shows and Conferences
Chart Industries actively uses trade shows and conferences to promote its brand. These events are crucial for showcasing products and networking. In 2024, Chart likely participated in major industry events, increasing brand visibility. This strategy helps maintain a strong presence in the energy and industrial gas sectors.
Digital Marketing and Online Presence
Chart Industries focuses on digital marketing to boost its online presence. Its website offers product details and showcases capabilities. This strategy aims to attract customers and generate leads. In 2024, digital marketing spending increased by 15%, reflecting its importance. Online channels support customer engagement and brand visibility.

Investor Communications and Events
Chart Industries focuses heavily on investor relations. They utilize presentations, earnings calls, and industry conferences to engage with investors. In Q1 2024, Chart held an earnings call, highlighting a 20% revenue increase. This approach provides transparency. It fosters trust, and keeps stakeholders informed about strategic plans.
Public Relations and News Releases
Chart Industries leverages public relations to disseminate information. They announce partnerships and financial results. This keeps stakeholders informed. This builds awareness of their achievements. In Q1 2024, Chart's revenue was approximately $870 million.
- News releases announce new partnerships.
- PR activities build awareness.
- Stakeholders stay informed.
- Q1 2024 revenue was about $870M.
Sustainability Reporting and ESG Focus
Chart Industries promotes its ESG commitment through sustainability reports. This approach attracts customers and investors focused on responsible practices. In 2024, ESG-focused assets grew, reflecting increased investor interest. Effective ESG communication can boost brand value and investor confidence.
- ESG assets grew by 15% in 2024.
- Sustainability reports enhance brand reputation.
- Investor interest in ESG continues to rise.
Promotional Strategies Drive $870M Revenue
Chart Industries uses various promotion methods. Trade shows and digital marketing boost visibility. Investor relations, PR, and ESG reports build brand trust and attract stakeholders. In Q1 2024, revenue hit $870 million, reflecting promotional success.
| Promotion Type | Activities | Impact |
|---|---|---|
| Trade Shows/Conferences | Product showcases, networking | Increased brand visibility |
| Digital Marketing | Website, online channels | Boosts online presence; lead generation |
| Investor Relations | Earnings calls, presentations | Fosters trust, keeps investors informed |
Price
Value-Based Pricing
Chart Industries employs value-based pricing, aligning with its high-value products. This approach is evident in their gross profit margin, which was approximately 29% in Q1 2024, indicating premium pricing. They focus on the benefits their equipment provides, such as efficiency and reliability. This strategy allows them to capture a greater share of the value they create for customers. As of April 2024, the company's market capitalization was around $7.7 billion.
Competitive Pricing in Specific Markets
Chart Industries assesses competitor pricing, vital in competitive markets or large project bids. They also factor in market demand and economic conditions. In 2024, competitor pricing significantly affected margins in industrial gas equipment sales. Economic shifts in the energy sector influenced pricing strategies. Data from Q1 2024 shows a 5% fluctuation in average selling prices due to market dynamics.

Contractual Pricing Agreements
Chart Industries uses contractual pricing for major projects. These contracts cover equipment, services, and support. For example, in 2024, 40% of Chart's revenue came from long-term contracts. This approach ensures stable pricing and builds strong client relationships. These agreements often span multiple years, providing predictable revenue streams.
Aftermarket Service Pricing
Aftermarket service pricing is critical for Chart Industries, encompassing repairs, servicing, and leasing. These services bolster revenue, often featuring higher margins. For example, in 2024, service revenue accounted for approximately 20% of Chart's total revenue. This stable income stream improves profitability.
- Service revenue contributed significantly to overall profitability.
- Higher margins are typical for these services.
- Leasing services also contribute to revenue.
- Repair services are a key component.
Influence of Raw Material and Supply Chain Costs
Chart Industries' pricing strategy is significantly impacted by raw material costs and supply chain issues. Fluctuations in steel, helium, and other key materials can lead to price adjustments. The company often incorporates price escalation clauses in contracts to manage these cost uncertainties. For instance, in 2024, steel prices saw a 15% increase, prompting Chart to reassess its pricing models.
- Raw material costs directly affect pricing decisions.
- Supply chain disruptions necessitate proactive pricing strategies.
- Contracts include clauses to mitigate cost volatility.
Pricing Dynamics and Margin Strategies
Chart Industries uses value-based pricing, aiming for premium margins. Competitive analysis and market dynamics influence pricing strategies, especially for industrial gas equipment. Contractual pricing and aftermarket services offer stable revenue and higher profit margins.
| Pricing Strategy Element | Details | Impact |
|---|---|---|
| Value-Based Pricing | Focus on product benefits, high gross margin (29% in Q1 2024) | Captures greater value, premium pricing |
| Competitive Pricing | Assess competitor prices, consider market demand | Influences margins, 5% ASP fluctuation in Q1 2024 |
| Contractual Pricing | Long-term contracts, 40% of revenue in 2024 | Ensures stable pricing and revenue streams |
4P's Marketing Mix Analysis Data Sources
The Chart Industries 4Ps analysis uses company filings, investor presentations, and industry reports. It also uses brand websites to provide accurate market data and actions.
