EMCOR Group Boston Consulting Group Matrix
Fully Editable
Tailor To Your Needs In Excel Or Sheets
Professional Design
Trusted, Industry-Standard Templates
Pre-Built
For Quick And Efficient Use
No Expertise Is Needed
Easy To Follow
EMCOR Group Bundle
What is included in the product
Tailored analysis for EMCOR's diverse business units across the BCG Matrix.
Export-ready design for quick drag-and-drop into PowerPoint, perfect for EMCOR Group's strategic presentations.
Full Transparency, Always
EMCOR Group BCG Matrix
The EMCOR Group BCG Matrix preview mirrors the final, downloadable document. This is the exact, comprehensive analysis you'll receive. Ready for strategic application, it comes without watermarks or extra steps.

BCG Matrix Template
Download Your Competitive Advantage
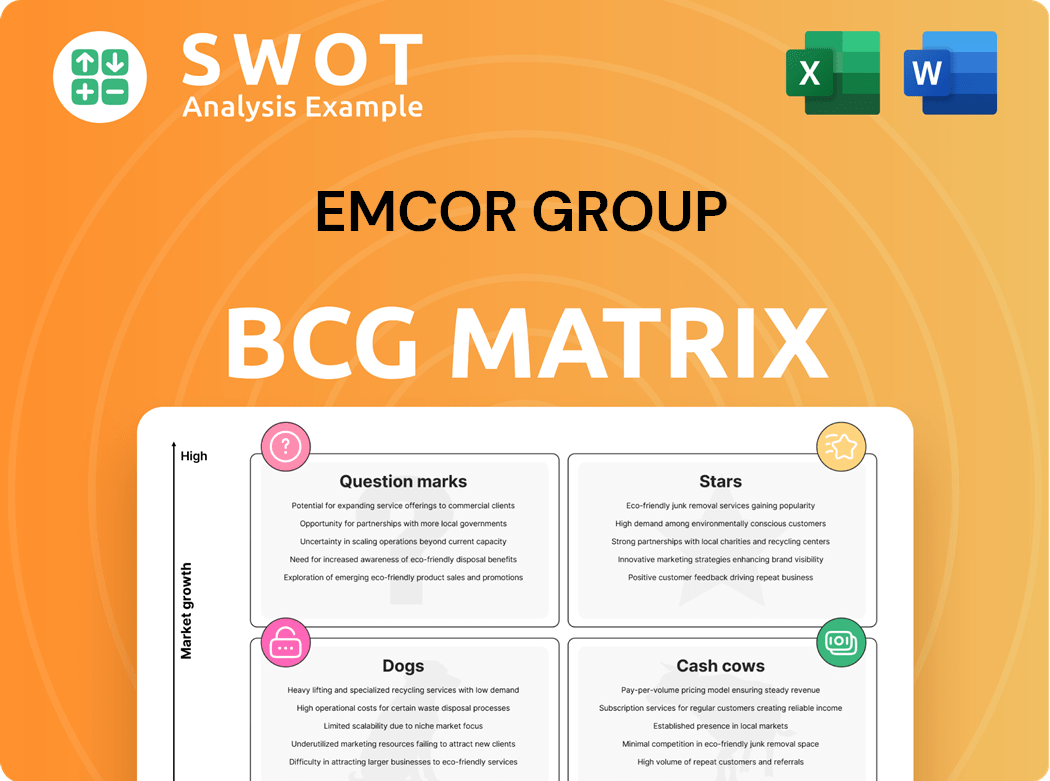
EMCOR Group's BCG Matrix offers a snapshot of its diverse business units. This matrix classifies them by market share and growth rate. Identifying "Stars," "Cash Cows," "Dogs," and "Question Marks" unveils strategic opportunities. It highlights units needing investment, those generating cash, and those needing careful management. This quick overview is just a taste. Purchase the full BCG Matrix to gain a complete understanding of EMCOR's strategic landscape.
Stars
U.S. Mechanical Construction
U.S. Mechanical Construction is a Star in EMCOR Group's BCG Matrix. This segment's revenue grew by 26.2% in 2024, with strong operating margins. EMCOR's digital tools boost productivity. This segment is a market leader and a significant cash generator.
U.S. Electrical Construction
U.S. Electrical Construction, a star within EMCOR Group, saw a 20.1% revenue surge. This segment excels due to data center and high-tech demand. Its high growth and market share position it favorably. The strong operating margin highlights its profitability in 2024.

Strategic Acquisitions
EMCOR Group's strategic acquisitions, like Miller Electric, boost its capabilities and market presence. These moves drive revenue growth and improve EMCOR's service to key sectors. In 2024, acquisitions significantly contributed to EMCOR's revenue. The integration of these acquisitions into EMCOR's business lines makes them a Star.
Network and Communications Sector
The network and communications sector, a key area for EMCOR, shows robust growth, especially in data center construction. EMCOR's proficiency in this field is a significant advantage, allowing it to meet the rising need for data center infrastructure. This sector's high growth rate coupled with EMCOR's strong market position classifies it as a Star within the BCG matrix.
- EMCOR's revenue in 2023 was $12.8 billion, with a notable portion from data center projects.
- The data center construction market is projected to grow, with an estimated value of $66.25 billion in 2024.
- EMCOR's projects in this sector often involve large-scale infrastructure deployments.
High-Tech Manufacturing Sector
EMCOR Group's high-tech manufacturing sector, encompassing semiconductors and electric vehicle projects, is a "Star" in its BCG matrix. This sector's strong demand for specialized construction services, such as those EMCOR provides, fuels its growth. EMCOR's strategic positioning within this dynamic area, alongside its robust performance, solidifies its star status. Revenue from the U.S. construction segment increased by 10.1% in 2023.
- High-Tech Manufacturing: Strong demand for EMCOR's services.
- Specialized Services: EMCOR's ability to provide construction services.
- Growth: This sector is experiencing growth.
- Financial Data: U.S. construction segment revenue increased by 10.1% in 2023.
EMCOR's Stellar Growth: Key Segments Soar in 2024!
Stars in EMCOR Group represent high-growth, high-share business units. These segments, like mechanical and electrical construction, generate significant revenue. They benefit from strong market positions and robust operating margins, fueled by data center and high-tech projects. Strategic acquisitions further boost capabilities, leading to impressive revenue increases in 2024.
| Segment | 2024 Revenue Growth | Key Drivers |
|---|---|---|
| U.S. Mechanical Construction | 26.2% | Digital tools, market leadership |
| U.S. Electrical Construction | 20.1% | Data centers, high-tech demand |
| Strategic Acquisitions | Significant | Miller Electric integration |
| Network & Communications | High | Data center construction |
Cash Cows
Facilities Services
EMCOR's facilities services, especially mechanical services, are steady performers. Demand stays consistent, fueled by energy retrofits and automation. This segment generates stable revenue and cash flow. In 2024, EMCOR's U.S. Construction segment, including mechanical services, saw significant revenue, reflecting this stability.
U.S. Building Services
EMCOR Group's U.S. Building Services is a Cash Cow, generating consistent cash flow. In 2024, the segment's revenue remained stable despite challenges. Mechanical services demand is strong, fueled by energy retrofits. This segment requires low investment, making it a reliable cash generator.

Existing Share Repurchase Program
EMCOR Group's share repurchase program reflects its dedication to shareholder value. The program is funded by operational cash flow, enabling open market or private repurchases. This initiative aligns with its Cash Cow status, supported by robust free cash flow. In 2024, EMCOR repurchased shares, enhancing shareholder returns. This strategy leverages a strong financial position.
Institutional Sector Projects
EMCOR Group's institutional sector is a Cash Cow, showcasing financial stability. Increased RPOs are fueled by research facilities and tech upgrades. Renovation projects focusing on air quality and energy savings are boosting demand. This sector ensures steady revenue and cash flow. In Q3 2023, EMCOR's total RPO was $7.3 billion.
- Increased RPOs
- Focus on renovations
- Steady revenue
- Cash flow
Energy Efficiency Retrofits
EMCOR Group's energy efficiency retrofits are a strong "Cash Cow." This segment provides consistent revenue from building automation and retrofit projects. Demand remains stable, ensuring a reliable income stream for EMCOR. These projects have been key for EMCOR's financial health. In 2024, the energy efficiency market continues to grow.
- EMCOR's revenue in 2024 is expected to reach $13.8 billion.
- Building automation market is projected to reach $93.9 billion by 2024.
- Retrofit projects are a reliable source of income.
EMCOR's Revenue Stream: $13.8 Billion in 2024!
EMCOR's "Cash Cows" consistently generate substantial cash flow. Key segments, like building services and energy retrofits, drive this. These sectors benefit from steady demand and require low investment. In 2024, EMCOR anticipates approximately $13.8 billion in revenue.
| Cash Cow Characteristic | Description | Supporting Data (2024) |
|---|---|---|
| Stable Revenue | Consistent income from established services. | Expected Revenue: $13.8 Billion |
| Low Investment Needs | Requires minimal reinvestment for maintenance. | Focus on Existing Infrastructure |
| Steady Demand | Driven by ongoing building and energy needs. | Building Automation Market: $93.9 Billion |
Dogs
U.K. Building Services
The U.K. Building Services, part of EMCOR Group, has struggled. Macroeconomic issues hit operating margins. Its performance lagged, showing limited growth. With low growth and market share, it's a Dog in the BCG Matrix. In 2024, this segment's revenue was down, reflecting these challenges.
Projects facing supply chain disruptions
EMCOR Group's projects could suffer from supply chain issues and fluctuating material costs. These problems can hurt project schedules and profits. Projects with these difficulties might be classified as "Dogs" due to their low growth and risk of losses. In 2024, construction material prices rose, impacting project budgets. For example, steel prices increased by 10% in Q3 2024, affecting profitability.

Small, owner-operated competitors
EMCOR Group contends with many small, owner-operated firms in construction services. These competitors can influence pricing and squeeze profit margins. In areas where EMCOR's efficiency lags, these smaller operations become a challenge. For example, in 2024, EMCOR's operating income was $855.7 million, with competition always a factor.
Geographic Regions with Limited Presence
In areas where EMCOR Group's presence is small, it's hard to grab market share. These places might not bring in much money or profit for the company. Such regions, showing slow growth and low market share, are classified as Dogs in the BCG Matrix. For example, in 2024, regions with limited EMCOR presence saw revenue growth below the company average.
- Market Share Struggle: Limited presence hinders market share growth.
- Revenue Impact: Low contribution to overall revenue and profit.
- BCG Classification: Identified as "Dogs" due to low growth, low market share.
- Example: 2024 data shows lower revenue growth in these areas.
Services with Declining Demand
If any of EMCOR's services face declining demand, they're "Dogs" in the BCG Matrix. These services have low growth and low market share. For example, older HVAC systems, a part of EMCOR's offerings, might decline as newer, more efficient ones rise. This could mean reduced revenue in that specific area. In 2024, demand for energy-efficient systems increased by 15%.
- Older HVAC systems could see declining demand.
- These services show low growth and market share.
- Demand for energy-efficient systems rose in 2024.
- This impacts revenue within specific services.
EMCOR's "Dogs": Underperforming Areas in 2024
EMCOR Group's "Dogs" include areas with low growth and market share. This can involve struggling segments like U.K. Building Services and projects affected by supply chain issues. Older HVAC systems also fall into this category due to declining demand. In 2024, regions with limited EMCOR presence showed revenue below average.
| Category | Characteristics | 2024 Impact |
|---|---|---|
| U.K. Building Services | Low growth, macroeconomic issues | Revenue decline |
| Projects with Issues | Supply chain problems, cost fluctuations | Reduced project profits |
| Older HVAC Systems | Declining demand | Decreased revenue |
Question Marks
Sustainable Energy Solutions
EMCOR's sustainable energy solutions are a Question Mark in its BCG matrix. This segment, focusing on energy efficiency, has high growth prospects. However, EMCOR's market share is likely low currently. For instance, the renewable energy sector saw a 17% growth in 2024. Investments could turn this into a Star.
Smart Building Solutions
EMCOR's smart building solutions, leveraging IoT, represent a Question Mark in the BCG matrix. The facilities management market is growing, and EMCOR aims to capture more of it. To boost market share, significant investments in these tech-driven services are crucial. In 2024, the global smart building market was valued at approximately $80 billion, offering substantial growth potential.

AI-Powered Facilities Solutions
AI's impact is reshaping facilities management. EMCOR should strategically invest in AI to boost performance. As a Question Mark, AI solutions demand careful investment decisions. In 2024, the global smart buildings market reached $93.2 billion. Strategic AI adoption is crucial for EMCOR's future.
Expansion into New Geographic Markets
EMCOR Group could be eyeing expansion into new geographic markets to boost growth. These markets often present high growth potential, but EMCOR's current market share might be low. This situation classifies them as a Question Mark within the BCG matrix, demanding substantial investment to capture market share. For example, in 2024, EMCOR's revenues reached $13.3 billion, indicating a strong financial position for such investments.
- High Growth Potential
- Low Market Share
- Significant Investment Required
- Potential for Future Growth
Service Offerings Targeting Infrastructure Projects
Focusing on infrastructure projects presents a Question Mark for EMCOR Group in its BCG matrix. This area offers high growth potential, fueled by increased government spending. However, EMCOR's current market share in this specific segment might be relatively low. Strategic investments are crucial to capitalize on these opportunities effectively.
- Infrastructure spending in the U.S. is projected to reach $2.3 trillion by 2024.
- EMCOR's recent acquisitions could position it for growth in infrastructure services.
- Market share gains require targeted bidding and project management expertise.
- Success depends on EMCOR's ability to secure profitable contracts.
Question Marks: High Growth, High Stakes!
Question Marks represent high-growth, low-share segments needing investment. EMCOR's initiatives like sustainable energy and smart buildings fit this profile, offering growth potential. AI and infrastructure projects also present Question Marks, requiring strategic investment. In 2024, infrastructure spending was about $2.3 trillion.
| Category | Characteristics | Implication |
|---|---|---|
| Market Growth | High | Opportunities for Expansion |
| Market Share | Low | Significant Investment Needed |
| Strategic Focus | Targeted Investments | Potential for High Returns |
BCG Matrix Data Sources
The BCG Matrix is based on comprehensive data. We use SEC filings, market research, competitor analysis, and expert evaluations for a robust view.
