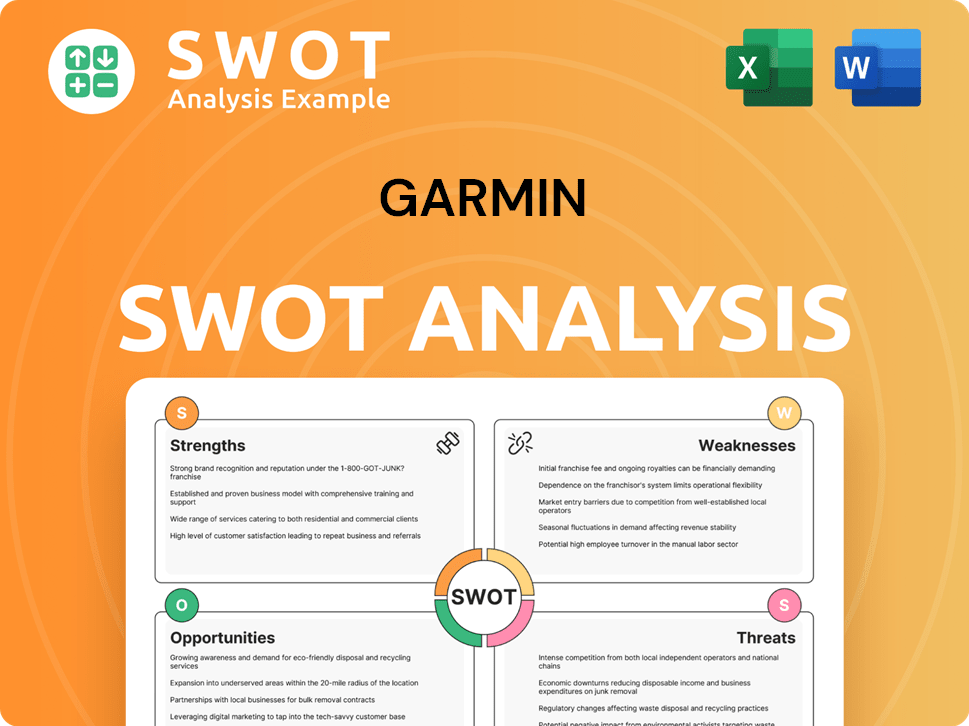
Garmin SWOT Analysis
Fully Editable
Tailor To Your Needs In Excel Or Sheets
Professional Design
Trusted, Industry-Standard Templates
Pre-Built
For Quick And Efficient Use
No Expertise Is Needed
Easy To Follow
Garmin Bundle
What is included in the product
Analyzes Garmin's competitive position through key internal and external factors.
Gives a high-level overview for quick stakeholder presentations.
What You See Is What You Get
Garmin SWOT Analysis
Get a look at the actual SWOT analysis file. This is a genuine preview, displaying the comprehensive report you'll receive. The full, in-depth analysis will be immediately accessible after your purchase. No hidden information – just the complete SWOT analysis. Buy now and get instant access.

SWOT Analysis Template
Your Strategic Toolkit Starts Here
Garmin's strengths include brand recognition and product diversification, but weaknesses like reliance on consumer spending exist. Opportunities in wearables and connected fitness contrast with threats from competitors and evolving technology. This overview gives you a taste of the strategic landscape.
Unlock the full SWOT report to gain detailed strategic insights, editable tools, and a high-level summary in Excel. Perfect for smart, fast decision-making.
Strengths
Diverse Product Portfolio
Garmin's strength lies in its diverse product portfolio, spanning fitness, outdoor, aviation, marine, and automotive sectors. This broad approach reduces reliance on any single market, spreading risk effectively. Recent successes in Fitness and Outdoor segments, like a 20% increase in sales in 2024, highlight the benefits of diversification. This strategy enables Garmin to capture various growth avenues, enhancing its market position.
Strong Brand Recognition and Reputation
Garmin benefits from strong brand recognition, especially in GPS and wearables, due to its reputation for quality and innovation. This enhances customer loyalty, a key advantage in competitive markets.

Innovation and Technology
Garmin excels in innovation, using GPS to develop appealing products. They heavily invest in R&D, exploring new technologies. In 2024, R&D spending reached $800 million, signaling a strong commitment. This focus drives advancements like micro-LEDs and enhanced satellite features, boosting their market edge.
Vertical Integration
Garmin's vertically integrated structure, including its own manufacturing, offers notable advantages. This approach allows for greater control over product quality and supply chains. Owning the manufacturing process also gives Garmin flexibility to adapt to market changes swiftly. This strategy can lead to cost efficiencies compared to outsourcing.
- In 2024, Garmin reported a gross margin of approximately 58%, reflecting efficient manufacturing.
- Garmin's vertical integration helps manage costs, as seen with a 2024 operating margin of about 24%.
- This model allows for faster innovation cycles, crucial in the fast-paced tech market.
Strong Financial Performance
Garmin's financial strength is a key asset, highlighted by consistent revenue growth and healthy profitability. In 2024, Garmin achieved record consolidated revenue, showcasing its market dominance. The company's robust Q1 2025 results further underscore its financial stability and ability to exceed expectations. This strong performance is supported by high gross profit margins and significant free cash flow, which fuels investments and innovation.
- Record consolidated revenue in 2024.
- Strong Q1 2025 results.
- High gross profit margins.
- Significant free cash flow.
Diversified Products Drive Growth and Innovation
Garmin’s varied product line, like the 20% growth in sales from Fitness and Outdoor in 2024, spreads risk and boosts market capture. Brand recognition and continuous innovation, backed by $800 million in R&D in 2024, set them apart in the competitive market. Their integrated structure, alongside healthy financial metrics, like the 58% gross margin in 2024, enhances control, cutting costs, and improving agility.
| Strength | Description | Data (2024/2025) |
|---|---|---|
| Product Diversity | Wide range of products, reducing market dependency. | 20% sales increase in Fitness/Outdoor. |
| Brand Recognition & Innovation | Quality reputation, investment in R&D. | $800M R&D spending in 2024. |
| Vertical Integration | Manufacturing control for cost and speed. | 58% gross margin in 2024. |
Weaknesses
Dependency on Licensing Mapping Data
Garmin's dependence on licensed mapping data introduces vulnerabilities. Data accuracy and availability are critical for GPS functionality.
Cost fluctuations in licensing agreements could impact profitability. Competitors developing in-house mapping systems present a threat.
In 2024, mapping and chart data costs represented a significant operating expense. Garmin's reliance on third-party data could affect its competitive edge.
Market Saturation and Intense Competition
Garmin faces stiff competition, especially in fitness and automotive sectors. Rapid innovation and shifting consumer tastes demand constant upgrades. This competition, from both established rivals and newcomers, may hurt profitability. In 2024, the wearables market saw significant growth, but Garmin's market share faced challenges.

Fragmented Product Lineup
Garmin faces a challenge with its product lineup. Some analysts find the extensive range of options confusing. This fragmentation may lead to consumer indecision. The company's revenue in 2024 reached approximately $5.23 billion.
Lower Display Resolution in Some Models
Some Garmin watch models still have lower-resolution MIP screens, leading some to feel they look cheaper, even if the price is high. These MIP displays are great for battery life, which is a huge advantage for outdoor use. However, compared to brighter, higher-resolution screens, they might not be as attractive to everyone. In 2024, the market saw a 15% increase in demand for wearables with vibrant displays.
- MIP screens offer excellent battery life, a key selling point.
- Higher-resolution displays are becoming more popular.
- Consumer preference shifts towards sharper visuals.
Lack of Strong Recurring Revenue from Subscriptions
Garmin's reliance on hardware sales presents a weakness. This model can lead to fluctuating revenue based on product cycles and market demand. Garmin is expanding into subscriptions, such as Connect+, but the current recurring revenue is not as robust as competitors. For 2024, hardware sales accounted for a significant portion of Garmin's revenue, approximately 75%.
- Subscription services are still in early stages of development.
- Hardware sales are subject to market volatility.
- Recurring revenue provides stability.
- Competitors have stronger subscription models.
GPS Accuracy, Profit & Market Share Risks
Garmin’s dependence on third-party data creates potential vulnerabilities, impacting GPS accuracy and profit margins. Stiff competition and rapid tech changes in fitness and automotive sectors pose revenue threats. Product fragmentation and reliance on hardware sales lead to consumer confusion and fluctuating revenue.
| Weaknesses | Impact | 2024 Data |
|---|---|---|
| Third-Party Data Dependence | Accuracy, Profitability | Mapping and chart data costs were significant. |
| Intense Competition | Market Share Erosion | Wearables market grew; Garmin faced share challenges. |
| Product Fragmentation/Hardware Focus | Consumer Confusion, Revenue Volatility | Hardware sales made ~75% of revenue. |
Opportunities
Expansion in Emerging Markets and Wearable Technology
Garmin sees opportunities in emerging markets and wearable tech. The wearable market hit $81.5 billion in 2023, growing further. Expansion in these markets can boost Garmin's revenue. Garmin's focus on wearables aligns with market growth.
Growth in Aviation and Marine Technology
Garmin can tap into aviation and marine tech growth. Emerging markets and automotive partnerships offer diversification. Garmin's aviation expansion with flight decks is a good move. The global aviation market is forecast to reach $377.7 billion by 2028. Marine tech is also growing.

Development of New Technologies
Garmin is investing in micro-LED displays and advanced 5G/satellite tech. They're also working on new optical sensing for biomarkers. These tech advancements could drive innovative products. In Q1 2024, Garmin's sales increased by 20% thanks to new product launches.
Strategic Partnerships
Strategic partnerships are a pathway for Garmin's growth and competitiveness. Collaborations, especially in automotive, can unlock new market segments. Garmin's strategic alliances help it stay ahead. For example, in 2024, Garmin expanded partnerships to enhance its product offerings. These collaborations are crucial for innovation and market expansion.
- Partnerships drive market share gains.
- Automotive collaborations broaden reach.
- Alliances boost technology and innovation.
- Strategic moves enhance competitive advantage.
Leveraging Community and Ecosystem
Garmin can capitalize on its strong community via the Connect platform, fostering user engagement and brand loyalty. Expanding the Connect ecosystem with premium services such as Connect+ could unlock new revenue streams. This approach requires careful execution to maintain user trust and avoid alienating its existing base.
- Garmin Connect has over 30 million active users.
- Connect IQ store has over 70,000 apps and watch faces.
- Garmin's wearables segment revenue in 2024 was $3.3 billion.
Tech Giant's Growth: Wearables, Aviation, and Partnerships!
Garmin’s opportunities lie in expanding wearable tech, forecasted to reach $102.9 billion by 2025. Growth in aviation and marine tech, projected to be worth $405 billion by 2029, also provides potential. Strategic partnerships, like those expanding in 2024, boost innovation.
| Opportunity Area | Data | Impact |
|---|---|---|
| Wearable Market | $81.5B (2023), est. $102.9B (2025) | Revenue Growth |
| Aviation Market | $377.7B (2028), marine tech expanding | Diversification, Expansion |
| Strategic Partnerships | Expanding in 2024 | Innovation, Market Reach |
Threats
Increased Competition from New Entrants and Tech Giants
Garmin faces growing threats from new competitors in the navigation and wearables markets. Tech giants like Apple and Google, through Fitbit, are increasing competition. In 2024, Fitbit held about 20% of the global wearables market. This intensifies pressure on Garmin's pricing and market share.
Technological Disruption and Changing Preferences
Technological advancements and changing consumer tastes can make Garmin's products outdated. Continuous innovation is essential to compete with new technologies. For instance, the wearables market is expected to reach $81.5 billion by 2025. Garmin's ability to adapt to these trends is crucial for survival.

Geopolitical Risks and Trade Policies
Garmin's international presence makes it vulnerable to geopolitical instability and shifts in trade regulations. Tariffs and trade wars can disrupt its supply chain, raising production costs. For instance, the US-China trade dispute in 2018-2019 affected tech firms. Rising costs could squeeze Garmin's profit margins. The company must adapt to these external pressures.
Supply Chain Disruptions and Rising Input Costs
Garmin faces threats from supply chain disruptions and rising input costs, potentially impacting its profitability. Some analysts have pointed out these vulnerabilities. For example, in Q1 2024, Garmin's gross margin decreased to 55.8% due to increased manufacturing costs. Such challenges can squeeze profit margins. These factors require careful management and strategic planning.
- Gross margin decreased to 55.8% in Q1 2024.
- Increased manufacturing costs impacted profitability.
Cybersecurity and Data Security
Garmin faces persistent cybersecurity threats, critical for a tech firm. Past incidents highlight vulnerabilities, potentially disrupting services and eroding user trust. Data breaches can lead to substantial financial losses and reputational damage. The 2020 ransomware attack cost Garmin $10 million.
- Cyberattacks can cause service disruptions.
- Data breaches can lead to financial losses.
- User trust can be significantly impacted.
Navigating the Threats: A Look at the Market
Garmin combats new navigation and wearables competitors, including Apple and Google, and Fitbit with about 20% of the global market share in 2024. Tech advancements and changing consumer preferences, especially in the wearables market which is expected to reach $81.5 billion by 2025, require constant innovation. Geopolitical instability, like US-China trade disputes affecting tech firms in 2018-2019, along with supply chain issues, can hurt margins.
| Threat | Impact | Data Point |
|---|---|---|
| Competition | Market share loss | Fitbit holds ~20% wearables market (2024) |
| Tech Change | Outdated products | Wearables market to $81.5B by 2025 |
| Supply Chain | Higher Costs | Gross margin at 55.8% (Q1 2024) |
SWOT Analysis Data Sources
This analysis uses financial reports, market analyses, and expert opinions to provide a data-backed and insightful SWOT assessment.
