Interface PESTLE Analysis
Fully Editable
Tailor To Your Needs In Excel Or Sheets
Professional Design
Trusted, Industry-Standard Templates
Pre-Built
For Quick And Efficient Use
No Expertise Is Needed
Easy To Follow
Interface Bundle
What is included in the product
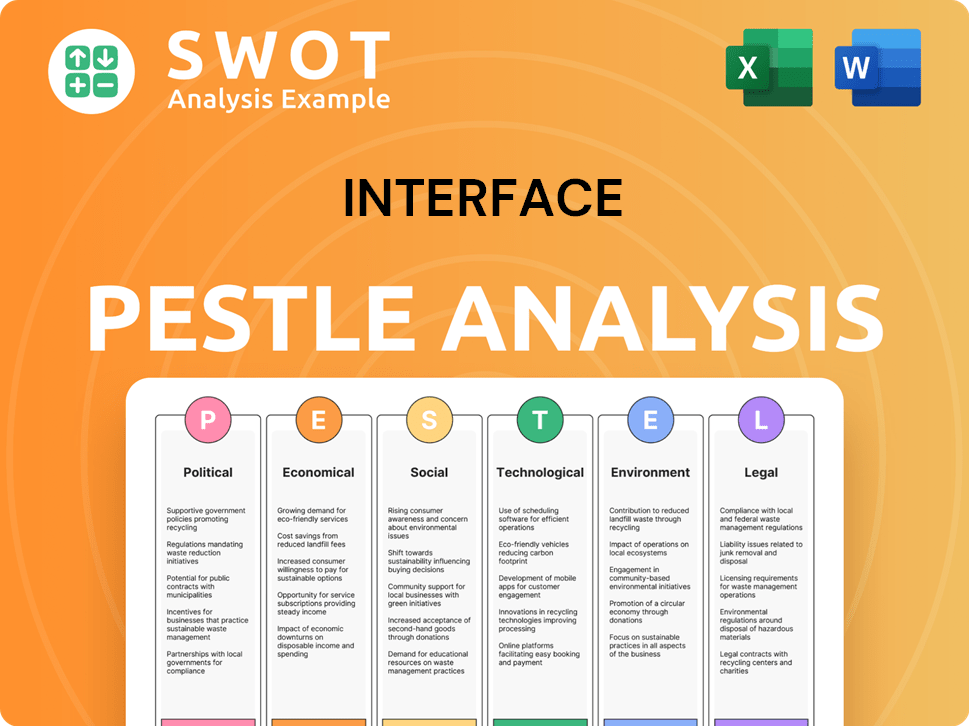
This analysis explores Interface's external environment across political, economic, social, technological, environmental, and legal factors.
Visually segmented by PESTLE categories, allowing for quick interpretation at a glance.
Preview the Actual Deliverable
Interface PESTLE Analysis
The preview provides an accurate look at this Interface PESTLE Analysis. What you're previewing is the actual file, completely formatted.

PESTLE Analysis Template
Make Smarter Strategic Decisions with a Complete PESTEL View
Understand how external factors influence Interface's trajectory. This PESTLE Analysis explores the key political, economic, social, technological, legal, and environmental forces at play. Uncover risks, identify opportunities, and strengthen your strategic planning with our expert insights. Boost your market analysis today. Download the full version now!
Political factors
Government Sustainability Policies
Governments worldwide are pushing for sustainable practices. Interface benefits from its eco-friendly focus. This could mean advantages like incentives for green initiatives. Policy shifts might affect costs or open new markets. In 2024, green tech spending is projected at $366.8 billion, growing to $482.1 billion by 2027.
Trade Regulations and Tariffs
Interface faces political risks from trade regulations. Changes in tariffs and import/export policies, particularly in North America and Europe, can impact costs. For instance, tariffs on raw materials could increase production expenses. In 2024, trade disputes continue to pose risks. These factors require strategic supply chain adjustments.

International Climate Agreements
International climate agreements, like the Paris Agreement, shape emissions reduction targets. Interface's goals align with these, but changes in targets or enforcement could impact strategy. For instance, the EU's Green Deal aims to cut emissions by at least 55% by 2030, influencing Interface's operations. In 2024, global climate finance needs are estimated at $2.4 trillion annually.
Political and Economic Stability in Operating Regions
Interface faces political and economic risks across its global operations. Instability in regions can lead to issues like policy changes or workforce management challenges. These factors directly affect business and financials. A 2024 report indicates that political risks cost businesses globally billions.
- Political risk insurance claims in 2023 totaled $1.2 billion.
- Changes in trade policies can increase costs.
- Managing global workforce is complex.
- Economic downturns can reduce sales.
Government Incentives for Green Manufacturing
Interface could gain from government incentives for green manufacturing and renewable energy. These incentives, varying by country, can affect investment decisions in facilities and tech. For example, the Inflation Reduction Act in the U.S. offers significant tax credits for green initiatives. In 2024, the global green tech market is projected to reach $366.9 billion.
- Tax credits for renewable energy projects.
- Grants for sustainable manufacturing.
- Subsidies for green technology adoption.
- Reduced corporate tax rates for eco-friendly practices.
Green Initiatives & Global Business: Key Factors
Interface’s eco-friendly stance aligns with global green initiatives, potentially unlocking benefits. Trade policies, like tariffs, can raise costs; 2023 saw $1.2B in political risk insurance claims. Climate targets and political risk in global operations pose challenges.
| Factor | Impact | 2024 Data |
|---|---|---|
| Green Incentives | Tax credits, grants | Green tech market: $366.9B |
| Trade Regulations | Increased costs | Ongoing disputes, cost rises |
| Climate Agreements | Emissions targets | $2.4T annual climate finance need |
Economic factors
Global Market Growth and Demand
The global flooring market's expansion, fueled by urbanization and interior design trends, significantly influences Interface's revenue potential. In 2024, the global flooring market was valued at approximately $370 billion, showing steady growth. Interface's performance, particularly in the Americas and EAAA regions, is crucial. For instance, Interface's Q1 2024 sales in the Americas increased by 5%, indicating strong demand.
Raw Material Costs and Availability
Raw material costs fluctuate, impacting Interface's production costs. Prices of materials like those used in modular carpet and LVT influence profitability. While recycled and bio-based materials are used, they also face market dynamics. For example, in Q1 2024, raw material costs increased by 3%.

Currency Exchange Rate Fluctuations
Currency exchange rate fluctuations significantly affect Interface's financial performance. A strong U.S. dollar can reduce reported net sales when translating revenues from other currencies. For instance, a 10% change in exchange rates could shift profitability. In 2024, currency impacts are a key focus.
Macroeconomic Uncertainty and Consumer Spending
Macroeconomic conditions significantly shape consumer and commercial spending, directly affecting the demand for flooring products. Economic uncertainty can curb investment in construction and renovation, which, in turn, impacts Interface's sales and backlog. The latest data indicates a cautious approach among consumers. For example, the U.S. consumer confidence index in March 2024 was 104.7, slightly down from February's 106.7, signaling some hesitance. Interest rate hikes also play a crucial role.
- U.S. construction spending decreased by 0.7% in February 2024.
- The Federal Reserve maintained interest rates in March 2024, but future cuts are uncertain.
- Interface's sales for Q4 2023 were $306.6 million, a decrease of 1.3% year over year.
Competition in the Flooring Market
Interface faces intense competition in the flooring market, with many manufacturers vying for market share. This competition directly influences pricing strategies, potentially squeezing profit margins. To stay ahead, Interface must constantly innovate in design and emphasize sustainability. This dynamic market requires adaptability to maintain a strong position.
- The global flooring market was valued at $378.6 billion in 2023 and is projected to reach $503.3 billion by 2030.
- Interface's main competitors include Mohawk Industries and Tarkett.
- Sustainability is a key differentiator, with eco-friendly products gaining popularity.
Economic Forces Shaping Performance
Economic factors heavily influence Interface's performance, from market growth to raw material costs.
Currency fluctuations and macroeconomic conditions impact sales and consumer spending, crucial for revenue.
Interest rates, construction trends, and competition demand strategic adaptability.
| Economic Factor | Impact | 2024/2025 Data |
|---|---|---|
| Market Growth | Drives Revenue | Global flooring market ~$370B in 2024, projected $503.3B by 2030. |
| Raw Materials | Affects Costs | Q1 2024: Raw material costs +3%. |
| Exchange Rates | Influences Profit | 10% change = potential profit shift. |
Sociological factors
Consumer Demand for Sustainable Products
Growing consumer awareness of environmental issues and a desire for sustainable options significantly impact purchasing choices. Interface benefits from this shift, given its strong reputation for eco-friendly products. In 2024, the global green building materials market was valued at approximately $360 billion, projected to reach $500 billion by 2027. This trend boosts demand for Interface's sustainable flooring, contributing to its market position.
Health and Well-being Trends
Consumers increasingly prioritize health, influencing product choices. Indoor air quality and building material health are key. Interface's low VOC emissions and healthier materials align with these trends. Demand for sustainable, healthy products is rising. In 2024, the global green building materials market was valued at $310.5 billion.

Workplace Design and the Future of Work
Workplace design shifts, fueled by remote work, are reshaping commercial flooring demand. Interface must adapt to these changes to remain competitive. In 2024, 30% of US workers were fully remote. This impacts office space needs, and thus, flooring choices.
Demographic Shifts and Urbanization
Urbanization and demographic shifts significantly impact Interface's market. Increased urbanization drives construction and renovation, boosting demand for flooring. This is particularly evident in sectors like education and healthcare, key for Interface. Interface's success is closely tied to these societal trends. For instance, in 2024, urban population growth in OECD countries was around 1.2%.
- 2024 saw a 3.5% rise in construction spending in urban areas.
- Healthcare infrastructure spending increased by 4.8% in Q1 2024.
- Education sector renovations grew by 2.9% in the same period.
- Interface's sales in these segments grew by 4% in the first half of 2024.
Social Responsibility and Ethical Sourcing
Consumers and businesses increasingly prioritize social responsibility and ethical sourcing, significantly impacting brand perception. Interface's commitment to ethical sourcing and fair labor practices enhances its brand image. This focus influences purchasing decisions, especially among environmentally and socially conscious consumers. In 2024, studies show 70% of consumers favor brands with strong ethical stances. This commitment helps maintain a competitive edge.
- 70% of consumers favor ethical brands (2024).
- Interface's focus on sustainability supports brand value.
Market Dynamics Shaping Flooring Demand
Societal shifts towards sustainability and health significantly impact purchasing. Interface benefits from its eco-friendly, healthy product offerings, catering to consumer preferences. Workplace design and demographic trends further reshape commercial flooring demand, with urbanization fueling construction. Social responsibility and ethical sourcing are crucial for brand perception; Interface's practices support a positive brand image.
| Sociological Factor | Impact | Data (2024) |
|---|---|---|
| Sustainability | Increased demand for eco-friendly products | $310.5B green building materials market |
| Health & Wellness | Prioritizing of healthier materials | Indoor air quality is key |
| Urbanization | Boosts construction and renovation | 3.5% rise in urban construction spending |
Technological factors
Innovation in Flooring Materials and Manufacturing
Technological advancements are crucial. Innovation in material science and manufacturing leads to better flooring, like Interface's products. Interface invests in R&D, spending $10 million in 2024, to stay competitive. They focus on sustainability and enhanced product features. This approach supports long-term market success.
Digital Technologies in Design and Sales
Digital technologies are reshaping Interface's design and sales strategies. Platforms, AI, and product visualization tools enhance customer experiences. Online sales are growing; in 2024, e-commerce accounted for $1.2 billion in flooring sales. Interface can boost efficiency and customer engagement using these technologies.

Technology in Supply Chain Management
Technological advancements are crucial for Interface's supply chain. Automation, AI, and blockchain enhance efficiency and cut costs. In 2024, supply chain tech spending hit $21.5B. Interface's tech adoption boosts transparency and resilience. This strategic move supports its sustainability goals.
Automation in Manufacturing
Automation is transforming Interface's manufacturing. This includes enhanced efficiency, product consistency, and lower labor expenses. Interface's commitment to automation, through investments in modern plant equipment, directly affects its production capacity. This technological shift allows for greater precision and scalability in operations.
- In 2024, Interface allocated $150 million to upgrade manufacturing facilities, enhancing automation capabilities.
- Automated processes have boosted production output by 18% in the last year.
Data Analytics and AI for Market Insights
Interface can leverage data analytics and AI to gain deeper market insights. These technologies help analyze trends, understand customer behavior, and optimize operational efficiency. For instance, the global AI market is projected to reach $1.81 trillion by 2030. This data can inform strategic decisions and drive growth.
- AI market growth: $1.81T by 2030
- Data analytics for customer behavior
- Operational efficiency optimization
Tech's Impact: R&D at $10M, E-commerce at $1.2B.
Technological advancements critically shape Interface. R&D investment reached $10M in 2024. Automation boosts efficiency and precision in manufacturing.
Digital strategies enhance design, sales and customer experiences. In 2024, e-commerce hit $1.2B, with AI optimization expanding insights.
Automation investment increased by $150M, which boosted the production up by 18%. Tech adoption fortifies supply chain resilience and sustainability efforts.
| Technological Aspect | Specifics | 2024 Data/Projections |
|---|---|---|
| R&D Spending | Innovation and product enhancement. | $10 million |
| E-commerce Sales | Digital sales channels. | $1.2 billion |
| Automation Investments | Manufacturing upgrades. | $150 million, boosting production by 18% |
Legal factors
Environmental Regulations and Compliance
Interface faces a complex web of environmental regulations across regions, impacting manufacturing, emissions, and waste. Compliance costs are significant, yet crucial for legal operation and sustainability. In 2024, environmental compliance spending was approximately $25 million. Non-compliance could lead to hefty fines and operational disruptions.
Product Safety and Quality Standards
Interface's flooring products must adhere to strict safety and quality standards. This includes certifications like Cradle to Cradle, crucial for sustainability. Compliance is essential to avoid legal issues and maintain customer confidence. In 2024, the global flooring market was valued at $378 billion, with significant legal implications for non-compliance.

Trade Laws and Tariffs
Interface must adhere to international trade laws, including import/export regulations and tariffs. In 2024, tariffs on raw materials or finished goods affected profitability. For example, the US-China trade tensions could increase costs. Any shift in trade policies can dramatically affect the company's access to markets and cost structure.
Labor Laws and Employment Regulations
Interface's global presence necessitates adherence to varied labor laws, wage regulations, and safety standards, posing significant legal considerations. The company must navigate complex employment regulations across different countries, impacting operational costs and compliance efforts. Non-compliance can lead to penalties and reputational damage, underscoring the importance of robust legal strategies. In 2024, labor law violations cost companies billions, highlighting the financial risks.
- Global labor law compliance is a complex and evolving landscape.
- Wage and hour regulations vary significantly by region.
- Health and safety standards are crucial for employee well-being.
- Failure to comply can result in hefty fines and legal battles.
Intellectual Property Protection
Interface must safeguard its intellectual property, such as designs and processes, through patents and trademarks. These legal protections are vital for maintaining a competitive edge. However, intellectual property laws differ across regions, creating complex compliance hurdles. For example, the EU's enforcement of IP rights saw over 46,000 customs detentions in 2023. These differences can impact Interface's global strategy.
- Patent filings in the U.S. increased by 2.5% in 2024.
- Trademark applications in the EU rose by 4% in 2024.
- Global counterfeit trade reached $509 billion in 2024.
Navigating Legal Complexities in Flooring: Costs & Risks
Interface navigates intricate legal terrains, from environmental to labor laws. These regulations directly influence its operational costs and strategic decisions. The flooring industry’s compliance is further complicated by diverse international trade and IP laws. Successfully maneuvering through these legal factors is critical to avoid penalties and maintain its market position.
| Legal Area | 2024 Impact | 2025 Outlook (Projected) |
|---|---|---|
| Environmental Compliance | $25M spent; potential fines | Further regulations, potentially higher costs |
| Labor Law | Multi-billion $ cost from violations | Increasing global compliance needs |
| Intellectual Property | Counterfeit trade reached $509B | Emphasis on stronger global enforcement |
Environmental factors
Climate Change and Carbon Footprint Reduction
Climate change significantly impacts business, increasing demand for eco-friendly products. Interface's commitment to carbon negativity by 2040 reflects this. The company aims to reduce its carbon footprint. Interface's focus on sustainability is a key strategy. This includes product development and operational changes.
Resource Depletion and Circular Economy
Growing concerns about resource depletion emphasize recycled materials and circular economy. Interface embraces closed-loop manufacturing and recycled content. Interface's 2023 sustainability report shows 90% recycled content in some products. They aim for 100% renewable electricity by 2025.

Waste Management and Recycling
Effective waste management and recycling programs are vital for minimizing environmental impact. Interface's ReEntry Reclamation program exemplifies efforts to reduce waste. In 2024, Interface reported a 25% reduction in waste sent to landfills. The program supports a sustainable product lifecycle. Interface's commitment is evident in its waste reduction targets for 2025.
Water Usage and Conservation
Water scarcity poses a significant challenge for manufacturing, potentially affecting Interface's operations. Stringent regulations on water usage can increase costs and limit production capabilities. Interface actively works to minimize its water footprint across its facilities. This commitment enhances its environmental profile and operational sustainability.
- Interface reduced water intake by 21% from 2019 to 2023.
- In 2023, 99% of Interface's manufacturing sites had water-efficient fixtures.
- The company aims for further water reductions by 2025.
Biodiversity and Ecosystem Impact
Interface, as a manufacturer, must address how its operations affect biodiversity and ecosystems. This includes evaluating the environmental impact of sourcing materials and manufacturing processes. Interface's dedication to ethical sourcing and reducing its footprint is crucial. They consider these impacts to minimize harm and promote sustainability. For example, Interface has reduced its carbon footprint by 46% since 1996.
- Ethical Sourcing: Interface's commitment to sourcing materials responsibly.
- Carbon Footprint: A 46% reduction since 1996 demonstrates their environmental focus.
- Sustainability: Interface aims to minimize harm to ecosystems and biodiversity.
Sustainability at the Core: Environmental Impact
Environmental factors significantly influence Interface's operations. Interface reduced water intake by 21% from 2019 to 2023 and aims for further reductions by 2025. Interface has reduced its carbon footprint by 46% since 1996, showcasing a dedication to environmental sustainability.
| Factor | Impact | Interface Response |
|---|---|---|
| Climate Change | Increased demand for eco-friendly products and stricter carbon regulations. | Commitment to carbon negativity by 2040. Focus on sustainability in product development. |
| Resource Depletion | Emphasis on recycled materials and the circular economy. | Closed-loop manufacturing, 90% recycled content, and 100% renewable electricity by 2025. |
| Waste Management | Need to minimize waste and environmental impact. | ReEntry Reclamation program, 25% waste reduction by 2024. |
PESTLE Analysis Data Sources
Interface's PESTLE leverages financial reports, scientific journals, regulatory databases, and tech publications.
