Lennar Porter's Five Forces Analysis
Fully Editable
Tailor To Your Needs In Excel Or Sheets
Professional Design
Trusted, Industry-Standard Templates
Pre-Built
For Quick And Efficient Use
No Expertise Is Needed
Easy To Follow
Lennar Bundle
What is included in the product
Analyzes competitive forces to understand Lennar's position, including threats and opportunities.
Quickly assess competitive intensity by inputting data into a dynamic, color-coded visual.
What You See Is What You Get
Lennar Porter's Five Forces Analysis
This preview shows the exact document you'll receive immediately after purchase—no surprises, no placeholders. The Porter's Five Forces analysis provides an in-depth look at Lennar, examining industry competition, supplier power, and buyer power. It assesses the threat of new entrants and substitutes, providing a clear understanding of the company's strategic landscape. This comprehensive analysis is ready for your immediate use upon purchase.

Porter's Five Forces Analysis Template
Go Beyond the Preview—Access the Full Strategic Report
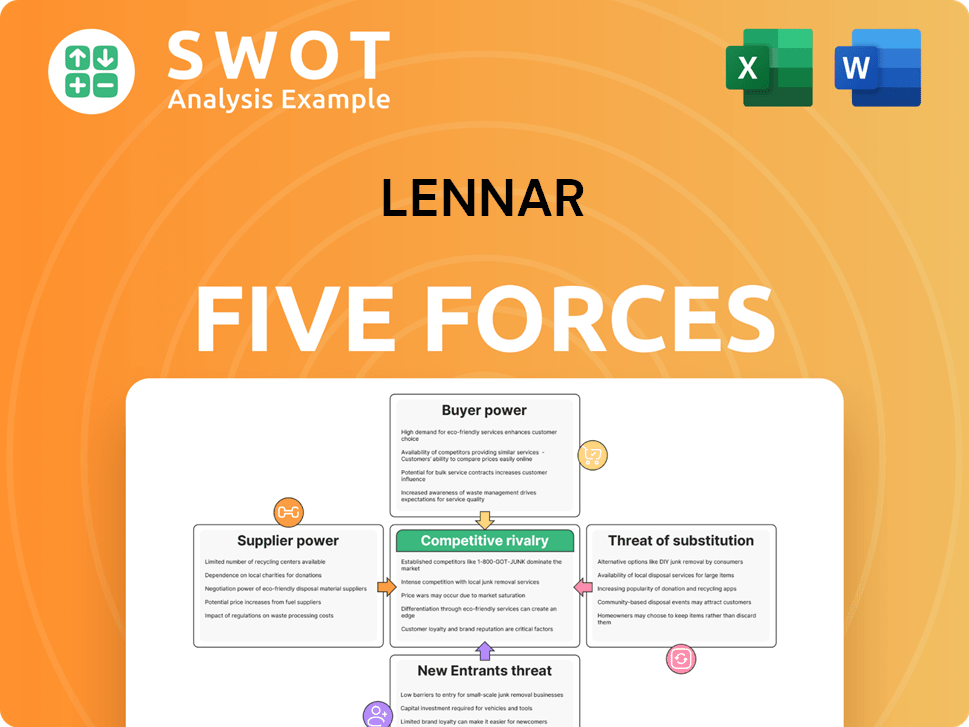
Lennar operates in a competitive housing market, shaped by the dynamics of Porter's Five Forces. Buyer power is significant, influenced by mortgage rates and economic conditions, impacting demand. The threat of new entrants is moderate, given existing industry regulations and land acquisition costs. Competitive rivalry is high, with numerous national and regional homebuilders vying for market share. Substitute products, such as existing homes, pose a moderate threat. Finally, supplier power, mainly from materials and labor, presents a steady challenge.
This brief snapshot only scratches the surface. Unlock the full Porter's Five Forces Analysis to explore Lennar’s competitive dynamics, market pressures, and strategic advantages in detail.
Suppliers Bargaining Power
Supplier power: moderate
Lennar's supplier power is moderate; they source from many for materials like lumber. Quality and timely delivery affect Lennar's costs. Lennar's scale helps negotiate, but shortages can shift power. In 2024, lumber prices fluctuated, impacting home construction costs.
Lumber prices fluctuate
Lumber is a key input cost for Lennar, and its price swings directly impact profitability. Suppliers, particularly those with significant lumber resource control, can pressure prices, especially when demand is high. In 2024, lumber prices experienced volatility, with fluctuations throughout the year. Lennar employs strategies like hedging and long-term contracts to manage this, but these methods aren't always effective against sudden price increases, potentially squeezing margins.

Labor market dynamics
Skilled labor is crucial for home construction. Labor shortages boost the bargaining power of subcontractors. Lennar must offer competitive wages to attract qualified workers. In 2024, construction labor costs rose, impacting home prices. The average hourly earnings for construction workers in the U.S. were around $34.
Concrete and cement suppliers
Concrete and cement suppliers hold considerable bargaining power due to the essential nature of their products for construction projects. This power is shaped by regional availability; in areas with few suppliers, costs can increase, affecting Lennar's profitability. Transportation costs significantly impact the final price, especially in regions with limited infrastructure. Lennar mitigates supplier power by diversifying its vendor base.
- In 2024, the average cost of concrete was approximately $130-$160 per cubic yard, varying by region.
- Transportation costs can add $10-$30 per cubic yard, depending on distance and logistics.
- Lennar's diversification strategy includes using multiple suppliers to negotiate better prices.
- Cement prices have seen a 5-10% increase in the past year.
Fixture and appliance manufacturers
Fixture and appliance manufacturers significantly impact Lennar's costs. These suppliers' power varies with brand recognition and product differentiation. Lennar uses its size to negotiate lower prices, but popular brands may maintain higher prices. In 2024, Lennar's cost of sales was around $25 billion, showing the impact of supplier costs.
- Lennar sources fixtures and appliances from various manufacturers.
- Supplier bargaining power depends on brand strength and product uniqueness.
- Lennar can use its buying power to get discounts.
- Premium brands can demand higher prices.
Lennar's Material Costs: A Bargaining Power Breakdown
Supplier bargaining power for Lennar varies across materials.
Lumber prices and labor costs have a significant impact.
Concrete and appliance suppliers also influence costs.
| Material | Supplier Power | 2024 Impact |
|---|---|---|
| Lumber | Moderate | Price volatility; hedging strategies |
| Labor | High | Rising wages; shortages |
| Concrete | Moderate | Regional price differences, $130-$160/cu.yd. |
Customers Bargaining Power
Buyer power: moderate
Homebuyers' bargaining power is moderate, swayed by interest rates and the housing market. In 2024, rising mortgage rates slightly curbed buyer power. However, if housing inventory increases, buyers gain more leverage. Lennar must respond with incentives or price adjustments to stay competitive. As of Q4 2024, new home sales saw a 5.6% decrease.
Interest rate sensitivity
Mortgage interest rates are crucial for homebuyer affordability, significantly affecting demand. Higher rates decrease purchasing power, making buyers more price-sensitive. In 2024, the average 30-year fixed mortgage rate fluctuated, impacting Lennar's sales. Lennar must adapt by adjusting offerings based on interest rate trends. For example, in late 2024, rates around 7% highlighted this sensitivity.

Housing market conditions
Local housing market conditions, like inventory and sales, shift buyer power. High inventory gives buyers more leverage. In 2024, U.S. housing inventory rose, boosting buyer negotiation skills. Lennar adjusts its strategies to suit local market trends. In Q1 2024, existing home sales dipped, indicating changing dynamics.
Customization options
The extent of Lennar's customization features directly impacts customer bargaining power. Extensive customization can justify higher prices, as seen with luxury home sales in 2024. Limited options might make buyers more price-sensitive, potentially reducing Lennar's profit margins. Lennar must carefully balance customization with cost management to satisfy buyer needs effectively.
- Customization influences price sensitivity.
- Extensive options allow premium pricing.
- Limited choices increase price sensitivity.
- Balance customization with cost efficiency.
Incentives and concessions
Lennar frequently uses incentives such as appliance upgrades or assistance with closing costs to attract homebuyers, influencing their perceived value. The attractiveness of these incentives is crucial, as highlighted by the National Association of Home Builders (NAHB), which reported a 1.9% increase in builder incentives in late 2023. This strategy helps Lennar stay competitive in markets where customer bargaining power is high. Lennar carefully manages incentive programs to balance sales volume and profit margins, a practice vital for navigating fluctuating market conditions. In 2024, Lennar's gross margin was approximately 22%, indicating effective management of these incentives.
- Incentives impact buyer value perception.
- NAHB data shows builder incentive trends.
- Lennar balances sales and profitability.
- 2024 gross margin was approximately 22%.
Lennar's 2024 Buyer Power: Moderate
Customer bargaining power in 2024 for Lennar is moderate, influenced by interest rates, housing inventory, and customization options. Rising mortgage rates and lower inventory levels, as seen in Q4 2024 with a 5.6% sales decrease, give Lennar some leverage. Incentives and customization strategies directly affect this dynamic, affecting prices and sales.
| Factor | Impact on Buyer Power | 2024 Data |
|---|---|---|
| Mortgage Rates | Higher rates reduce power | Avg. 30-yr ~7% |
| Housing Inventory | Lower inventory reduces power | Inventory increased |
| Customization | Extensive options increase pricing power | Luxury home sales |
Rivalry Among Competitors
Competition: intense
The homebuilding sector is fiercely competitive, involving many national, regional, and local companies. Lennar contends with tough rivals in securing land, attracting buyers, and finding skilled workers. This competition can spark price wars and shrink profit margins. In 2024, the U.S. housing market saw intense competition, with existing home sales down, reflecting the battle for market share.
National homebuilders
Lennar faces intense competition from national homebuilders like D.R. Horton and PulteGroup. These rivals possess substantial financial strength and established brand recognition, increasing competitive pressure. In 2024, D.R. Horton reported over $36 billion in revenue, a testament to its market presence. Lennar must effectively differentiate to maintain its market share. This differentiation could involve unique product designs, superior customer service, or strategic geographic targeting.

Regional and local builders
Regional and local builders, equipped with specialized local market knowledge, present a competitive challenge to Lennar. They can adapt more quickly to local preferences and demands, requiring Lennar to adjust its strategies. In 2024, local builders captured a significant share of the market, particularly in areas with strong regional economic growth. For instance, in the Southwest, local builders saw a 15% increase in new home sales, highlighting the need for Lennar to compete effectively.
Land acquisition
Competition for desirable land is intense among homebuilders, making land acquisition a crucial aspect of Lennar's strategy. Securing prime land parcels often involves bidding wars, which inflates land costs. Lennar needs a strong land acquisition strategy to ensure a steady supply of developable land at competitive prices. This is vital for maintaining profitability and market share.
- In 2024, the median existing-home sales price rose to $388,800.
- Lennar's land acquisition spending was substantial, reflecting the competitive landscape.
- The cost of land acquisition is a significant factor in the overall cost of new homes.
- A robust land acquisition strategy is essential for sustainable growth.
Product differentiation
Product differentiation is vital in the competitive housing market. Lennar, like its rivals, differentiates through innovative designs and sustainable building practices. This strategy involves smart home tech and energy-efficient features. Lennar's revenue in 2024 reached approximately $35 billion, reflecting its market position.
- Smart home technology implementation increased by 15% in new Lennar homes in 2024.
- Sustainable building practices reduced construction waste by 10% in 2024.
- Lennar’s community amenities saw a 20% increase in resident satisfaction scores in 2024.
Homebuilding Showdown: Rivals Clash!
Lennar navigates a cutthroat market, facing rivals like D.R. Horton. Price wars and margin pressures are common. Regional builders add to the challenge, adjusting to local demands.
| Key Competitive Metrics (2024) | ||
|---|---|---|
| D.R. Horton Revenue | $36B+ | |
| Smart Home Tech Increase | 15% | |
| Lennar Revenue | $35B |
SSubstitutes Threaten
Rental housing
Rental apartments and single-family rentals pose a threat as substitutes for homeownership. The appeal of renting hinges on affordability, lifestyle, and economic trends. In 2024, the national median rent was around $1,379, influencing housing choices. Lennar must adapt its strategies, considering the competitive rental landscape and its impact on home sales.
Existing homes
Existing homes are a major substitute for new builds. In 2024, existing home sales totaled around 4.09 million units. Buyers often consider existing homes for their established locations and potentially lower prices. Lennar combats this by showcasing new homes' modern features and energy efficiency.

Renovation and remodeling
Homeowners might opt for renovations instead of new homes, especially with high interest rates. This shift poses a threat to Lennar. In 2024, remodeling spending is projected to reach $490 billion, highlighting the competition. Lennar must highlight new homes' advantages like lower upkeep and contemporary features to combat this.
Co-living and shared housing
Co-living and shared housing arrangements are a substitute for traditional housing, especially for young adults and those in urban areas. These alternatives often provide affordability and a sense of community, potentially drawing customers away from Lennar's offerings. Lennar needs to understand these shifts to create competitive housing solutions. The co-living market is expanding, with estimated growth.
- Co-living spaces can be 20-30% cheaper than traditional apartments.
- Demand for co-living is increasing, particularly in major cities.
- Lennar's response could include developing co-living projects.
- The shared housing market is projected to continue growing.
Manufactured homes
Manufactured homes offer a cheaper housing alternative, especially in less urban areas. They act as a substitute for traditional homes, though not everyone wants them. Lennar needs to stand out with quality, design, and location to compete.
- The median sales price for new manufactured homes in the U.S. was around $116,700 in 2024, significantly lower than the average price of a new site-built home.
- In 2024, manufactured homes accounted for approximately 10% of new single-family home sales in the U.S.
- States with higher manufactured home sales include Texas, Florida, and North Carolina.
- Lennar's ability to offer diverse housing options, including in-demand locations, is crucial.
Market Substitutes Impacting New Home Sales
Substitutes like rentals, existing homes, and renovations affect Lennar's market. Rental apartments' appeal, with a national median rent of $1,379 in 2024, impacts home sales. Existing homes, with sales around 4.09 million units in 2024, offer alternatives.
Renovations, expected to reach $490 billion in spending in 2024, compete with new builds. Co-living spaces also offer affordability. Manufactured homes, with median prices around $116,700 in 2024, pose a cost-effective choice.
Lennar must emphasize its offerings' advantages to stay competitive. This requires focusing on modern features, strategic locations, and diverse housing solutions to counter various substitutes.
| Substitute | Description | 2024 Data |
|---|---|---|
| Rental Apartments | Alternative to homeownership. | Median Rent: ~$1,379 |
| Existing Homes | Established housing options. | Sales: ~4.09 million units |
| Home Renovations | Improvements over new builds. | Spending: ~$490 billion |
Entrants Threaten
Capital intensity
Homebuilding demands substantial capital for land, materials, and labor. This high capital intensity restricts new entrants. Lennar, with robust financial backing, holds a key advantage. In 2024, Lennar's assets totaled over $35 billion, showcasing its financial strength.
Regulatory hurdles
The homebuilding industry faces significant regulatory hurdles, including zoning laws, building codes, and environmental regulations. These regulations can be complex and time-consuming, increasing the barrier to entry for new competitors. Lennar benefits from its established expertise in regulatory compliance, giving it a competitive edge. In 2024, regulatory compliance costs account for roughly 5-7% of total construction costs. This advantage helps Lennar maintain its market position.

Land availability
The availability of land significantly limits new entrants. Securing land demands strong ties with landowners and developers. Lennar's established land acquisition network offers a competitive edge. In 2024, land costs accounted for about 25% of the total development costs. New entrants face higher land costs.
Brand recognition
Brand recognition is a crucial factor in the homebuilding sector. Lennar, as a well-established company, benefits from strong brand recognition, giving it an edge in attracting customers. New entrants face the challenge of building brand awareness and trust, requiring significant investments in marketing and advertising. These investments are essential to compete effectively.
- Lennar's brand value is a key asset.
- New builders spend heavily on marketing.
- Customer trust is built through brand recognition.
- Established brands attract more buyers.
Economies of scale
Economies of scale pose a significant threat to new entrants in the homebuilding industry. Established companies like Lennar benefit from cost advantages in purchasing materials, construction processes, and marketing efforts. This scale advantage allows them to offer more competitive pricing. Smaller builders struggle to match these lower costs, creating a barrier to entry. Lennar's operational efficiency, driven by its size, strengthens its market position.
- Lennar's revenue for 2023 was approximately $34.2 billion.
- Lennar's gross margin in 2023 was around 22.7%.
- Lennar operates in 28 states across the U.S. as of 2024.
- Lennar's market capitalization is approximately $38 billion as of May 2024.
Homebuilding: Navigating Entry Barriers
The homebuilding sector sees moderate threats from new entrants, primarily due to high capital needs and regulatory hurdles. Lennar's financial strength and established market position reduce this threat. Despite challenges, the industry's growth potential continues to attract new players.
| Factor | Impact on New Entrants | Lennar's Advantage |
|---|---|---|
| Capital Requirements | High; land, materials, labor. | Strong financial backing ($35B assets in 2024). |
| Regulations | Complex and costly compliance (5-7% costs). | Established expertise and compliance. |
| Land Acquisition | Limited land availability, high cost (25% costs). | Established land acquisition network. |
Porter's Five Forces Analysis Data Sources
This Lennar analysis leverages SEC filings, industry reports, and market research data. Financial statements and analyst insights also play a crucial role.
