Nestlé Porter's Five Forces Analysis
Fully Editable
Tailor To Your Needs In Excel Or Sheets
Professional Design
Trusted, Industry-Standard Templates
Pre-Built
For Quick And Efficient Use
No Expertise Is Needed
Easy To Follow
Nestlé Bundle
What is included in the product
Detailed analysis of each competitive force, supported by industry data and strategic commentary.
Quickly see the intensity of competition with a color-coded, intuitive visual.
Same Document Delivered
Nestlé Porter's Five Forces Analysis
This preview details Nestlé's Porter's Five Forces, examining rivalry, new entrants, suppliers, buyers, and substitutes. The analysis assesses industry competition and profitability factors. It includes in-depth insights on each force impacting Nestlé's market position. You're looking at the actual document. Once you complete your purchase, you’ll get instant access to this exact file.

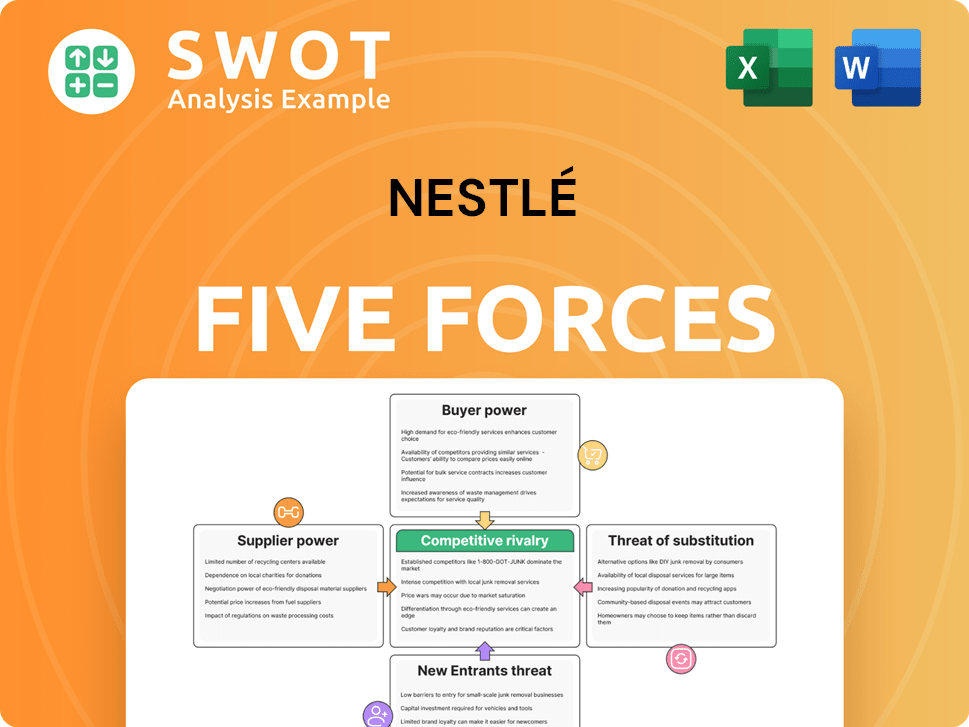
Porter's Five Forces Analysis Template
Don't Miss the Bigger Picture
Nestlé's competitive landscape is shaped by the interplay of powerful forces. Supplier power, like that of commodity providers, can influence margins. Buyer power, particularly from large retailers, also impacts profitability. The threat of new entrants remains a consideration, especially with evolving market trends. Substitutes, such as plant-based alternatives, pose another challenge. Finally, existing competitors, from Unilever to PepsiCo, create constant pressure.
Ready to move beyond the basics? Get a full strategic breakdown of Nestlé’s market position, competitive intensity, and external threats—all in one powerful analysis.
Suppliers Bargaining Power
Supplier Relationships
Nestlé strategically manages supplier relationships to control costs and ensure quality. The company's strong bargaining power stems from its size and the volume of materials it purchases. These established relationships with suppliers, offering long-term contracts, help Nestlé secure favorable terms.
Global Sourcing
Nestlé's global sourcing significantly reduces supplier power. In 2024, it sourced ingredients from diverse regions. This diversification protects against supply disruptions. Nestlé's broad network enhances cost control and market flexibility.

Responsible Sourcing
Nestlé's responsible sourcing strategy, crucial for its operations, significantly impacts supplier bargaining power. The company mandates that suppliers adhere to strict environmental and social standards, effectively limiting their ability to dictate terms. In 2024, Nestlé sourced over 80% of its key ingredients through responsibly sourced channels. This commitment reinforces Nestlé's control, ensuring supply chain sustainability and ethical practices.
Commodity Dependence
Nestlé's dependence on agricultural commodities exposes it to supplier power, yet its massive scale offers a counterweight. The company's substantial purchasing volume enables it to secure favorable terms, mitigating price volatility's impact. Nestlé's negotiation strength is crucial in managing costs. In 2024, raw materials accounted for a significant portion of Nestlé's expenses, highlighting the importance of supplier relationships.
- Raw materials costs are a significant part of Nestlé's operational expenses.
- Nestlé's size provides considerable bargaining power.
- Effective supplier management is key to profitability.
- Price fluctuations can significantly affect profits.
Vertical Integration
To counteract supplier power, Nestlé strategically uses vertical integration. This approach allows Nestlé to control elements of its supply chain. By doing so, Nestlé decreases reliance on external suppliers. It boosts control over raw material costs and quality, improving efficiency and profitability.
- In 2024, Nestlé's revenue was around CHF 92.5 billion.
- Nestlé's vertical integration includes ownership of coffee farms and water bottling plants.
- This strategy helps manage input costs, which can fluctuate based on supplier pricing.
- Vertical integration enables Nestlé to ensure the quality of ingredients used in its products.
Dominating the Supply Chain: A Look at the Giant's Strategy
Nestlé’s bargaining power over suppliers is strong, thanks to its size and global reach. This lets Nestlé negotiate favorable terms, controlling costs effectively. Vertical integration further strengthens its control over the supply chain, ensuring quality and managing costs.
| Aspect | Details |
|---|---|
| 2024 Revenue | Approximately CHF 92.5 billion |
| Responsible Sourcing | Over 80% of key ingredients |
| Key Strategy | Vertical integration & global sourcing |
Customers Bargaining Power
Brand Loyalty
Nestlé benefits from strong brand loyalty, which lessens customer bargaining power. This loyalty stems from consumers' trust in well-known brands. In 2024, Nestlé's global brand value reached approximately $20 billion, showing consumer preference. This loyalty allows Nestlé to maintain pricing power. The company's stable market position is reinforced by consumer willingness to pay more for its products.
Product Variety
Nestlé's vast product variety, spanning categories like coffee, pet food, and bottled water, significantly dilutes customer bargaining power. This diverse portfolio, with over 2,000 brands globally, reduces the impact of any single consumer's purchasing decisions. For instance, in 2024, Nestlé reported CHF 92.6 billion in sales, demonstrating its ability to withstand fluctuations in individual consumer preferences. This broad selection strengthens Nestlé's market position.

Retail Channel Influence
Retail channels significantly influence Nestlé. Large chains can pressure Nestlé, yet its strong brands are crucial for retailers, balancing power. Nestlé's popular products guarantee retailer demand, ensuring shelf space. In 2024, Nestlé's global retail sales were over CHF 90 billion, reflecting its market presence.
Price Sensitivity
Consumers' price sensitivity is rising, especially with the growth of private-label brands, boosting buyer power. Nestlé faces pressure to provide competitive value to retain customers. In 2024, private-label brands captured significant market share, impacting major food companies. Nestlé must innovate and offer quality products at competitive prices to stay ahead.
- Private-label brands grew by 5% in 2024, increasing competition.
- Nestlé's 2024 revenue showed a slight decrease due to pricing pressures.
- Consumers are increasingly switching to cheaper alternatives.
- Nestlé invests heavily in R&D to offer better value.
E-commerce Impact
The surge in e-commerce has significantly increased price transparency, giving consumers more power and intensifying competition. Online platforms offer easy access to a wide array of products and price comparisons, influencing consumer choices. This necessitates that Nestlé maintains a strong online presence, offering compelling value to attract and retain customers. In 2024, e-commerce sales accounted for 16% of total retail sales globally.
- Increased price transparency puts pressure on Nestlé to offer competitive pricing.
- Online platforms provide consumers with various product options and easy price comparisons.
- Nestlé must maintain a strong online presence and offer value.
- E-commerce sales represented 16% of global retail sales in 2024.
Buyer Power Dynamics: A Look at the Food Giant
Nestlé's brand strength and product variety limit customer bargaining power, yet rising price sensitivity and e-commerce are increasing it. Although consumers show brand loyalty, the growth of private-label brands and online price transparency add pressure. In 2024, e-commerce sales hit 16% of global retail, demanding competitive pricing and a strong online presence.
| Factor | Impact | 2024 Data |
|---|---|---|
| Brand Loyalty | Reduces Buyer Power | Nestlé's brand value ~$20B |
| Product Variety | Dilutes Buyer Power | Sales: CHF 92.6B |
| Price Sensitivity | Increases Buyer Power | Private Label Growth: 5% |
| E-commerce | Increases Buyer Power | E-commerce: 16% of retail |
Rivalry Among Competitors
Market Share
Nestlé, the world's largest food and beverage company, faces fierce rivalry. Competitors like PepsiCo and Unilever constantly challenge Nestlé's market share. This intense competition, particularly in key markets, drives innovation and efficiency. In 2023, Nestlé reported CHF 92.6 billion in sales, illustrating the stakes in this competitive landscape.
Competitor Landscape
Nestlé faces fierce competition. Key rivals like Unilever, PepsiCo, and Mondelez have vast portfolios and global reach. These competitors battle in many categories, increasing the intensity of rivalry. For example, in 2024, Unilever's revenue was about €60 billion, showing the scale of the competition Nestlé deals with.

Marketing and Advertising
Nestlé heavily invests in marketing and advertising. This strategy helps maintain brand visibility and customer loyalty within a competitive market. The company's marketing efforts differentiate products and build strong brand recognition. In 2024, Nestlé's advertising and marketing expenses were significant, contributing to its market position.
Innovation
Innovation is crucial in the food and beverage industry, pushing Nestlé to create new products and adapt. This helps Nestlé stay competitive and meet changing consumer needs. In 2024, Nestlé invested heavily in R&D, with expenditures reaching $2.1 billion. This investment fuels the development of healthier and more sustainable products. The company's focus on innovation drives sustainable growth.
- $2.1 billion in R&D investment in 2024.
- Continuous product development to meet consumer preferences.
- Focus on healthier and sustainable products.
- Innovation as a key driver of growth.
Pricing Strategies
Aggressive pricing strategies among Nestlé's competitors, like Unilever and Kraft Heinz, can significantly squeeze profit margins. This competitive pressure necessitates a careful balancing act for Nestlé, ensuring they remain price-competitive without sacrificing profitability. In 2024, Nestlé's operating profit margin was approximately 17.3%, a figure they must protect. Navigating this balance is vital for Nestlé to retain its market share and maintain robust financial health, which is crucial for long-term sustainability.
- Price wars can erode profitability, as seen in the coffee market.
- Nestlé must leverage brand strength to justify premium pricing in some segments.
- Cost-efficiency and innovation are critical to offset price pressures.
- Monitoring competitor pricing is essential for strategic adjustments.
Nestlé's 2024: Innovation & Competition
Nestlé confronts intense rivalry from giants like Unilever and PepsiCo. This competition fuels innovation and strategic marketing. The food and beverage sector sees continuous product development. In 2024, Nestlé's marketing expenses were considerable.
| Metric | Details | Year |
|---|---|---|
| R&D Investment | $2.1 billion | 2024 |
| Operating Profit Margin | 17.3% | 2024 |
| Unilever Revenue (approx.) | €60 billion | 2024 |
SSubstitutes Threaten
Brand Alternatives
The threat of substitutes for Nestlé is significant due to the wide availability of alternative food and beverage products. Consumers can readily swap between brands and product types, increasing competition. Nestlé must focus on product differentiation and brand loyalty to maintain market share. For example, in 2024, the global beverage market, which includes many substitutes for Nestlé's products, was valued at over $1.9 trillion.
Changing Consumer Preferences
Health-conscious consumers are increasingly substituting traditional products. In 2024, the global market for plant-based alternatives surged, with an estimated value of $36.3 billion. Nestlé faces pressure to adapt. They need to offer nutritious choices to meet evolving demands.

Private Label Growth
The increasing popularity of private-label brands poses a significant threat to Nestlé. These brands offer consumers budget-friendly options, heightening the risk of substitution. In 2024, private-label market share grew, especially in the food sector, putting pressure on established brands. For instance, in the U.S., private-label sales increased by 5.2% in 2024, impacting Nestlé's sales.
Convenience vs. Health
Consumers increasingly favor fresh, unpackaged foods over processed alternatives, presenting a substitution threat to Nestlé. This shift towards healthier eating habits compels Nestlé to innovate with convenient, nutritious products. The demand for natural foods is growing, with the global organic food market valued at $200 billion in 2024. Nestlé's ability to adapt to these trends will determine its success in the face of this substitution threat.
- The global organic food market was valued at $200 billion in 2024.
- Consumers are increasingly seeking healthier food choices.
- Nestlé needs to offer convenient yet nutritious options.
Emerging Trends
The threat of substitutes is increasing for Nestlé, particularly with the rise of health-conscious consumers. Functional foods and beverages, offering added health benefits, are gaining popularity and pose a risk. Nestlé must innovate to stay competitive, or risk losing market share to these alternatives. Adapting product offerings with functional ingredients is crucial to mitigate this threat.
- The global functional food market was valued at $267.9 billion in 2023.
- Nestlé's health and wellness segment, which includes functional products, saw growth in 2024.
- Consumer demand for plant-based alternatives continues to rise.
Nestlé's Challenges: Plant-Based Surge & Market Shifts
Nestlé faces strong substitute threats due to diverse food and beverage options and changing consumer preferences. The plant-based market reached $36.3 billion in 2024, showing the shift towards alternatives. Private-label brands also intensified competition. Nestlé must differentiate and adapt.
| Market Segment | 2024 Value (USD Billions) | Key Trend |
|---|---|---|
| Plant-Based Foods | $36.3 | Growth in health-conscious choices |
| Global Beverage | $1.9T | Competition among brands |
| Organic Food | $200 | Demand for natural products |
Entrants Threaten
High Capital Requirements
Nestlé faces a moderate threat from new entrants due to high capital requirements. The food and beverage sector demands substantial investments in production facilities, supply chains, and advertising. For instance, establishing a new large-scale food processing plant can cost hundreds of millions of dollars. This financial hurdle significantly reduces the likelihood of new competitors challenging Nestlé's market position.
Economies of Scale
Nestlé's vast scale creates significant barriers for new competitors. Its extensive operations enable lower production and distribution costs. This cost advantage, bolstered by a 2024 revenue of CHF 92.7 billion, is challenging to replicate. New entrants face an uphill battle to match Nestlé's efficient cost structure. This makes it tough for them to compete effectively.

Brand Recognition
Nestlé's established brand recognition presents a major obstacle for new competitors. Their strong reputation fosters customer loyalty, a key advantage. New entrants struggle to compete with this built-in trust and market presence. In 2024, Nestlé's global brand value was estimated at over $20 billion, showcasing their dominance.
Distribution Channels
Nestlé's robust distribution network presents a significant barrier to new entrants. Nestlé leverages its established relationships with retailers worldwide, ensuring product visibility and accessibility. New companies face substantial challenges in replicating this extensive reach, which limits their market penetration. This advantage helps protect Nestlé's market share. Securing shelf space and building distribution infrastructure demands considerable investment and time.
- Nestlé's global distribution network includes over 2,000 brands.
- In 2024, Nestlé's sales reached approximately CHF 92.6 billion.
- New entrants struggle to match Nestlé's established supply chain efficiency.
- The cost to build a comparable distribution network is extremely high.
Regulatory Compliance
Regulatory compliance poses a significant barrier to entry in the food and beverage industry. New entrants must navigate complex regulations set by bodies like the FDA in the U.S. and the EFSA in Europe. These requirements demand substantial investment in testing, labeling, and safety protocols, increasing initial costs. Moreover, ongoing compliance necessitates continuous monitoring and adaptation to evolving standards, adding to operational expenses.
- FDA inspections in 2023 resulted in over 1,000 warning letters to food and beverage companies.
- The average cost to launch a new food product, including regulatory compliance, can range from $500,000 to over $1 million.
- Compliance with the Food Safety Modernization Act (FSMA) has led to a 15-20% increase in operational costs for many food businesses.
- The EU's General Food Law requires businesses to trace food products throughout the supply chain, adding complexity and cost.
Nestlé's Market Fort: Entry Barriers & Dominance
The threat of new entrants for Nestlé is moderate. High capital needs and strict regulations create entry barriers, limiting competition. Nestlé's brand recognition and vast distribution network further protect its market position. Nestlé's 2024 revenue of CHF 92.7 billion highlights its dominance.
| Factor | Description | Impact |
|---|---|---|
| Capital Requirements | High investment in facilities, supply chains, and advertising. | Reduces the likelihood of new competitors. |
| Brand Recognition | Strong customer loyalty and market presence. | Makes it difficult for new entrants to compete. |
| Distribution Network | Extensive global reach with over 2,000 brands. | Challenges new companies in market penetration. |
| Regulatory Compliance | Complex regulations and compliance costs. | Increases initial and operational expenses. |
Porter's Five Forces Analysis Data Sources
The Nestlé analysis leverages company reports, market studies, and financial data.
