New Balance Porter's Five Forces Analysis
Fully Editable
Tailor To Your Needs In Excel Or Sheets
Professional Design
Trusted, Industry-Standard Templates
Pre-Built
For Quick And Efficient Use
No Expertise Is Needed
Easy To Follow
New Balance Bundle
What is included in the product
Analyzes New Balance's competitive position by examining its industry forces and threats.
Quickly adjust force ratings to model various competitor responses and market shifts.
Preview Before You Purchase
New Balance Porter's Five Forces Analysis
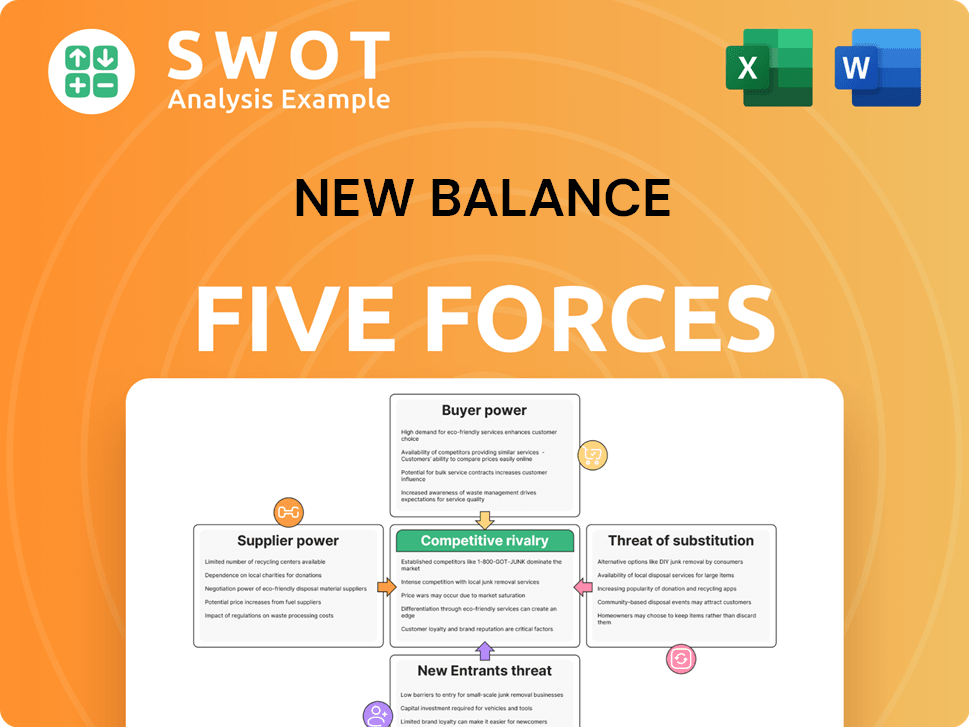
This preview shows the exact document you'll receive immediately after purchase—no surprises, no placeholders. This New Balance Porter's Five Forces analysis examines competitive rivalry, supplier power, buyer power, threat of substitution, and threat of new entrants. It provides a detailed understanding of the athletic footwear industry and New Balance's strategic positioning. You'll gain actionable insights and a comprehensive market overview immediately.

Porter's Five Forces Analysis Template
From Overview to Strategy Blueprint
New Balance faces intense competition in the athletic footwear market, battling established giants and emerging brands. Buyer power is moderate, influenced by consumer choice and price sensitivity. The threat of new entrants, while present, is tempered by brand recognition and distribution barriers. Substitute products, like athleisure wear, pose a challenge. Supplier power is a factor, particularly with raw materials and manufacturing.
This brief snapshot only scratches the surface. Unlock the full Porter's Five Forces Analysis to explore New Balance’s competitive dynamics, market pressures, and strategic advantages in detail.
Suppliers Bargaining Power
Supplier Dependence on New Balance
New Balance's 'Green Leaf Standard' and supplier code of conduct promote robust relationships. Suppliers of specialized materials have moderate bargaining power. In 2024, New Balance's revenue was approximately $6.5 billion. Annual compliance audits for Tier 1 suppliers reinforce standards.
Sustainability Demands
New Balance's sustainability goals, targeting 100% preferred leather and 50% recycled polyester by 2025, influence supplier relationships. This commitment, amid growing eco-consciousness, shifts power towards sustainable material providers. The global athletic footwear market shows a trend: recycled materials are crucial. In 2024, the market for sustainable materials grew, impacting supply chain dynamics.

Limited Supplier Concentration
The athletic footwear industry's diverse supplier base limits supplier power. New Balance's innovation and domestic supplier network expansion reduce supplier influence. Global supply chain optimization, sourcing from many areas, mitigates geopolitical and pandemic risks. In 2024, New Balance's revenue was approximately $6.5 billion, reflecting its supply chain's resilience.
Supplier Switching Costs
New Balance likely deals with manageable supplier switching costs, especially for specialized materials. The company's sourcing diversification reduces dependency on any single supplier. This strategy helps mitigate risks, as seen during the COVID-19 pandemic's supply chain disruptions. In 2024, New Balance continues to broaden its supplier network.
- Supplier switching costs are present but manageable.
- Diversified sourcing reduces supplier dependence.
- COVID-19 highlighted the benefits of diversified sourcing.
- New Balance continues expanding its supplier network in 2024.
Ethical Sourcing Requirements
New Balance's ethical sourcing demands, covering environmental and social aspects, narrow down supplier choices. This can boost the bargaining power of compliant suppliers. The company's focus on tracing raw materials, such as cotton yarn, shows a commitment to ethical origins. In 2024, New Balance increased its sustainable material use by 15%. This commitment adds to supplier influence.
- Ethical sourcing reduces the supplier pool.
- Compliant suppliers gain bargaining power.
- New Balance traces raw material origins.
- Sustainable material use grew in 2024.
Supplier Power Dynamics: A 2024 Overview
New Balance manages supplier power through diverse sourcing and ethical standards. Despite specialized materials, switching costs remain manageable. In 2024, they boosted sustainable material use by 15%, impacting supplier dynamics.
| Aspect | Impact | 2024 Data |
|---|---|---|
| Revenue | Influence | $6.5 Billion |
| Sustainability | Power Shift | 15% Increase in sustainable material use |
| Supplier Network | Risk Mitigation | Continued Expansion |
Customers Bargaining Power
Brand Awareness
New Balance benefits from strong brand awareness, especially in the U.S., which provides some pricing power. In 2024, 88% of U.S. sneakerheads knew the brand. Limited global recognition compared to Nike and Adidas boosts customer bargaining power. Only 40% held a positive view of the company in 2024. This impacts pricing strategies.
Price Sensitivity
In 2024, customer price sensitivity in the sporting goods sector is heightened by inflation. New Balance, positioned in the mid-range, faces challenges in competing on price. Over 50% of U.S. consumers are trading down on sporting goods. This shift impacts New Balance's pricing power.

Customer Switching Costs
Customer switching costs in the athletic footwear market are typically low, which elevates customer bargaining power. Consumers can readily switch to rivals such as Nike, Adidas, or Puma, particularly if these companies offer superior pricing or more fashionable designs. For instance, in 2024, Nike held about 27% of the global footwear market. New Balance's diverse product range is a key differentiator, but it might not be sufficient to retain customers if prices aren't competitive. In 2023, New Balance’s revenue was approximately $6.5 billion.
Product Differentiation
New Balance's product differentiation strategy significantly impacts customer bargaining power. The brand's "Made in USA" and "Made in UK" manufacturing, along with customization options, create a strong product identity. This approach reduces customer sensitivity to price. New Balance's focus on performance and fit resonates with customers prioritizing quality.
- Manufacturing in the US and UK represents approximately 20% of New Balance's global production.
- Customization options contribute to customer loyalty.
- New Balance's revenue in 2023 was around $5.3 billion.
Online Retail Growth
The rise of online retail has significantly amplified customer bargaining power. This is due to increased access to information and a broad selection of alternatives. To stay competitive, New Balance needs to boost its online presence and e-commerce strategies. Digital transformation continues, with approximately 32% of global apparel and footwear sales happening online.
- Customer access to information is easier than ever.
- Online retail offers a vast selection of alternatives.
- New Balance must strengthen its e-commerce initiatives.
- Around 32% of global apparel and footwear sales occur online.
Customer Power Dynamics: A Sneaker Story
Customer bargaining power for New Balance varies due to brand recognition and global presence. In 2024, 40% held a positive view, influencing pricing.
Price sensitivity is high, with over 50% of U.S. consumers trading down on sporting goods. Switching costs are low as consumers can easily choose competitors.
Differentiation through "Made in USA/UK" manufacturing and customization reduces this power. About 32% of apparel sales are online, boosting customer access to options.
| Aspect | Impact | Data |
|---|---|---|
| Brand Awareness | Impacts Pricing | 88% of U.S. sneakerheads knew the brand in 2024 |
| Price Sensitivity | Increased by Inflation | Over 50% of U.S. consumers trading down |
| Switching Costs | Generally Low | Nike holds 27% of the global footwear market |
Rivalry Among Competitors
Intense Competition
The athletic footwear market is a battlefield, with New Balance facing off against Nike, Adidas, and Puma. This high competition forces New Balance to innovate to stay relevant. Emerging brands such as On and Hoka add to the pressure, vying for market share. In 2024, Nike held roughly 55% of the US athletic footwear market.
Market Share
New Balance faces intense competition. Despite $7.8 billion in 2024 global sales, its market share lags. They hold about 4% globally and 10% in the U.S. This smaller share intensifies rivalry with giants like Nike and Adidas.

Product Innovation
The athletic footwear industry is highly competitive, with product innovation being a key battleground. New Balance faces pressure to continuously innovate with new technologies and materials. The company's R&D spending is crucial, with the CEO anticipating a materials revolution. In 2024, the global athletic footwear market was valued at $100 billion, highlighting the stakes.
Marketing and Endorsements
New Balance navigates intense marketing and endorsement competition. Nike and Adidas, with massive budgets, dominate celebrity partnerships, influencing consumer preferences significantly. Their focus on fashion-forward designs and aggressive advertising campaigns poses a challenge. New Balance's emphasis on functionality might not resonate with all consumers, requiring strategic adaptation.
- Nike's marketing spend in 2024 reached approximately $4 billion, far exceeding New Balance's budget.
- Adidas's global brand value in 2024 was estimated at $19.4 billion, showcasing its marketing power.
- New Balance's 2024 revenue was around $5.3 billion, highlighting the need for cost-effective marketing strategies.
- Celebrity endorsements can increase sales by 10-15% in the athletic footwear market.
Globalization
Globalization has significantly heightened competition in the athletic footwear market. New Balance faces challenges from international brands and a broader product range. The company must increase its global presence and adapt to consumer trends. Competition comes from local brands like Anta and rising ones like OnRunning and Hoka. Lululemon's performance also adds to the pressure.
- Anta Sports' revenue grew by 16.2% in 2023, reaching approximately $8.5 billion.
- On Holding AG (OnRunning) saw its net sales increase by 46.6% in 2023, reaching $1.79 billion.
- Lululemon Athletica Inc. reported a revenue increase of 19% in fiscal year 2023, totaling $9.6 billion.
- New Balance's estimated global revenue in 2023 was around $6.5 billion.
Footwear Face-Off: Market Share & Revenue
The athletic footwear market is a fiercely competitive landscape. New Balance fights giants like Nike and Adidas, each with significant market share and marketing budgets. They constantly innovate and adapt to consumer trends to remain competitive. Their global revenue reached approximately $7.8 billion in 2024.
| Metric | Data | Source/Year |
|---|---|---|
| Nike US Market Share | ~55% | 2024 |
| New Balance Global Market Share | ~4% | 2024 |
| Adidas Global Brand Value | $19.4B | 2024 Est. |
| Nike Marketing Spend | $4B | 2024 Approx. |
SSubstitutes Threaten
Casual Footwear
Casual footwear significantly threatens athletic footwear, especially with the rise of athleisure. New Balance faces this challenge by innovating and differentiating its products. Athleisure's popularity is evident, with the global market valued at $2 billion in 2022. It's projected to hit $3.2 billion by 2032, impacting New Balance's market share.
Performance Apparel
Performance apparel poses a threat as a substitute for athletic footwear, particularly for activities prioritizing comfort and functionality. New Balance faces competition from brands offering high-tech sportswear, like moisture-wicking fabrics, which are now widely used. In 2024, the global sportswear market, including apparel, reached approximately $400 billion. To compete, New Balance must provide a wide range of athletic products.

Barefoot Training
The rise of barefoot training and minimalist footwear offers a substitute for New Balance's athletic shoes, appealing to consumers prioritizing natural movement. New Balance needs to address this niche, offering versatile options to cater to diverse consumer tastes. Circular-knit seamless garments enhance flexibility, ideal for various activities. In 2024, the global athletic footwear market was valued at approximately $95 billion, with minimalist footwear capturing a growing segment.
Secondhand Market
The secondhand market poses a threat to New Balance as consumers increasingly opt for used athletic footwear. This shift is driven by the availability of affordable alternatives on resale platforms. New Balance's 'Reconsidered' program is a direct response to this trend, offering pre-owned shoes. In 2024, the global resale market for apparel and footwear was valued at over $190 billion, demonstrating its significant impact.
- Resale market growth is outpacing traditional retail.
- New Balance's 'Reconsidered' program aims to capture resale revenue.
- The program offers pre-owned shoes via the New Balance website.
Other Sporting Activities
The threat of substitutes in the sporting goods market is significant for New Balance. Other sporting activities and fitness regimens influence demand for athletic footwear. To counteract this, New Balance needs to offer a wide range of shoes. The popularity of activities such as running and basketball drives the need for specialized footwear. In 2024, the global athletic footwear market was valued at approximately $100 billion.
- Market Diversification: New Balance must diversify its product offerings to cater to various sports.
- Fitness Trends: The rising popularity of fitness activities impacts footwear demand.
- Market Size: The athletic footwear market is large and competitive.
- Specialized Footwear: Demand for specialized shoes is increasing due to diverse activities.
Market Pressures on Footwear
Substitutes, like athleisure and secondhand options, challenge New Balance. Performance apparel and minimalist footwear also compete in the market. To stay relevant, New Balance must offer diverse, specialized products.
| Threat | Impact | Data (2024) |
|---|---|---|
| Athleisure | Increased Competition | $3.2B market by 2032 |
| Secondhand | Affordable Alternatives | $190B resale market |
| Sportswear | Demand Shift | $400B global market |
Entrants Threaten
Established Brand Loyalty
New Balance benefits from strong brand loyalty, a key barrier for new entrants. The brand's focus on quality and ethical practices strengthens customer ties. New Balance's financial stability, with an estimated $5.3 billion in revenue in 2023, underscores its market position. Its commitment to durable, comfortable footwear sets it apart.
Capital Requirements
The athletic footwear industry demands substantial capital for R&D, manufacturing, and marketing, hindering new competitors. New Balance's focus on digitalization, brand activities, and manufacturing fueled its success. High initial capital costs are a significant barrier. For example, Nike spent $4.7 billion on SG&A in 2024, showing investment scale.

Economies of Scale
Established footwear giants, such as Nike and Adidas, leverage significant economies of scale in manufacturing, distribution, and advertising, creating a formidable barrier for newcomers. New Balance, while maintaining brand exclusivity through selective distribution, might not achieve the same cost advantages. Supply-side economies of scale, driven by high production volumes, give incumbents a cost edge. For example, in 2024, Nike's marketing spend was around $4 billion, showcasing the scale advantage.
Distribution Channels
New entrants in the athletic footwear market face significant distribution hurdles. Securing access to established distribution channels, like retail partnerships and online platforms, is crucial but difficult. New Balance's existing strong retail ties, such as those with Foot Locker, provide a considerable advantage, making it harder for newcomers to compete. New Balance emphasizes maintaining its brand image across all distribution points.
- Foot Locker's 2023 revenue was approximately $7.4 billion.
- New Balance's global sales in 2023 were estimated to be around $6.5 billion.
- Online sales account for a significant portion of athletic footwear sales, with the e-commerce market growing steadily.
- New Balance's strategic control over its brand presentation across various channels is a key competitive factor.
Global Supply Chain
Building a global supply chain is a significant hurdle for new entrants, demanding considerable expertise and financial resources. New Balance's dedication to ethical and environmental standards, such as its 'Green Leaf Standard,' creates a high entry barrier. This standard requires suppliers to adhere to a strict code of conduct, including environmental impact assessments. Before any order, suppliers must pass social and environmental compliance audits, demonstrating a strong commitment to responsible sourcing.
- New Balance's revenue in 2023 was approximately $5.3 billion.
- The footwear market is highly competitive, with established brands holding significant market share.
- Ethical sourcing and sustainability initiatives require substantial investment.
- Compliance audits and supplier management add to operational costs.
Athletic Footwear: Entry Barriers
The threat of new entrants in the athletic footwear market is moderate due to substantial barriers.
High capital investments in R&D and marketing, like Nike's $4 billion marketing spend in 2024, deter new competitors.
Established brands' economies of scale, and strong distribution networks, such as Foot Locker's $7.4 billion revenue in 2023, pose significant challenges.
| Barrier | Impact | Example |
|---|---|---|
| Capital Needs | High | Nike spent $4.7B on SG&A in 2024 |
| Economies of Scale | Significant | Adidas's vast production capacity |
| Distribution Access | Challenging | Foot Locker's established network |
Porter's Five Forces Analysis Data Sources
This analysis leverages annual reports, market research, and industry publications for a robust view of competition.
