New Balance SWOT Analysis
Fully Editable
Tailor To Your Needs In Excel Or Sheets
Professional Design
Trusted, Industry-Standard Templates
Pre-Built
For Quick And Efficient Use
No Expertise Is Needed
Easy To Follow
New Balance Bundle
What is included in the product
Analyzes New Balance’s competitive position through key internal and external factors.
Provides a high-level overview for quick stakeholder presentations.
What You See Is What You Get
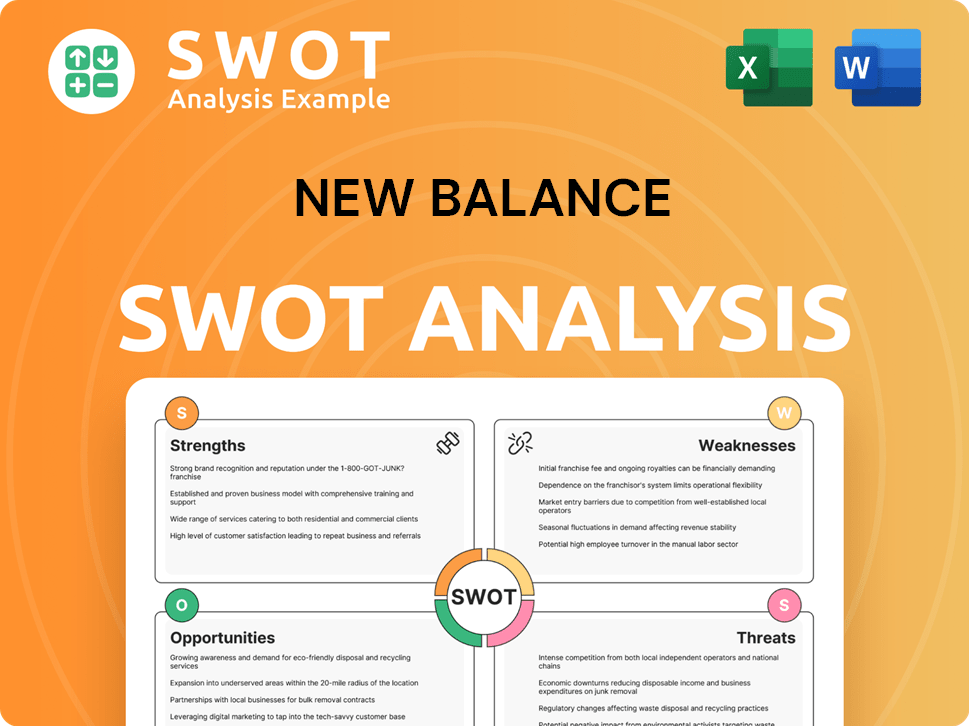
New Balance SWOT Analysis
See the actual SWOT analysis right here. This is the same comprehensive document you will receive upon purchase.

SWOT Analysis Template
Your Strategic Toolkit Starts Here
New Balance excels in comfort, design, and strong brand loyalty. However, intense competition and supply chain issues present challenges. Limited marketing spend vs rivals and reliance on key demographics also warrants caution. The SWOT provides detailed analysis, perfect for strategic planning and understanding market dynamics.
Discover the complete picture behind the company’s market position with our full SWOT analysis. This in-depth report reveals actionable insights, financial context, and strategic takeaways—ideal for entrepreneurs, analysts, and investors.
Strengths
Commitment to Local Manufacturing
New Balance's dedication to local manufacturing is a key strength. This strategy resonates with consumers who prioritize locally made products. In 2024, roughly 25% of New Balance footwear was produced in the U.S. and U.K. facilities. This approach supports premium pricing and rapid market adaptation.
Strong Financial Position
New Balance showcases a strong financial position. The brand achieved record global sales of $7.8 billion in 2024, a 20% increase. This financial strength supports investments in marketing and R&D.

Solid Brand Reputation
New Balance's enduring presence since 1906 has solidified its brand reputation. This legacy has fostered trust and loyalty among customers. In 2024, New Balance's brand value was estimated at $6.8 billion. This strong brand recognition supports premium pricing and market share.
Innovation and Technology
New Balance excels in innovation, constantly investing in R&D to integrate cutting-edge tech. This dedication boosts performance, comfort, and durability, keeping them ahead. Their focus on innovation is evident in their sales; in 2024, their revenue reached approximately $6.5 billion. This approach allows New Balance to meet evolving needs, like the shift towards sustainable materials.
- R&D investment drives product advancements.
- Innovation enhances product performance and appeal.
- Technology helps meet modern consumer demands.
- Increased revenue supports ongoing innovation.
Strategic Collaborations and Partnerships
New Balance's strategic alliances have significantly boosted its brand image. These partnerships with athletes like Coco Gauff and teams such as the Boston Celtics have expanded market reach. Collaborations with brands like Stone Island also create cultural relevance. In 2024, these partnerships contributed to a 15% increase in global sales.
- Partnerships with athletes and teams increase brand visibility.
- Collaborations with cultural figures enhance relevance.
- These alliances boost sales and market reach.
- In 2024, global sales rose by 15%.
Key Strengths of a Footwear Giant
New Balance's strengths include local manufacturing, with roughly 25% of footwear made in the U.S. and U.K. Their financial health, evidenced by $7.8 billion in global sales in 2024, supports marketing and R&D. They have a strong brand reputation, with an estimated brand value of $6.8 billion, which helps with premium pricing.
| Strength | Details | 2024 Data |
|---|---|---|
| Local Manufacturing | Production in the U.S. and U.K. | 25% of footwear |
| Financial Strength | Strong revenue and investment capabilities | $7.8B global sales |
| Brand Reputation | Established trust and customer loyalty | $6.8B brand value |
Weaknesses
Higher Manufacturing Costs
New Balance's commitment to manufacturing in the U.S. and U.K. leads to elevated production costs. This contrasts with rivals who leverage cheaper labor markets. For instance, as of late 2024, labor costs in China were significantly lower. This can affect pricing strategies and profitability margins. This cost structure may limit market share growth.
Emphasis on Function Over Fashion
New Balance's focus on function can be a weakness. Its historical emphasis on performance over style may limit its appeal to consumers prioritizing trends. In 2024, the global sportswear market is estimated at $400 billion, with fashion-forward brands gaining traction. However, New Balance is adapting. The company is increasing its lifestyle segment, aiming for a more diverse customer base.

Reliance on the United States Market
New Balance's strong dependence on the US market poses a risk. In 2024, approximately 60% of New Balance's revenue came from the United States. Economic downturns or shifts in consumer preferences within the US could significantly impact sales. Expanding globally is essential to balance this risk and ensure sustainable growth.
Limited Celebrity Endorsements Compared to Competitors
New Balance's reliance on fewer celebrity endorsements compared to rivals like Nike and Adidas presents a weakness. This strategy, though emphasizing authentic athletic performance, may restrict visibility and appeal. The global sports apparel market, valued at $193.6 billion in 2023, shows how crucial marketing is. Limited endorsements can particularly affect younger demographics.
- Nike's marketing spend in 2024 reached $4 billion.
- Adidas's celebrity collaborations drove significant sales growth in 2024.
- New Balance's 2024 revenue was $6.5 billion.
- The endorsement market is projected to reach $20 billion by 2025.
Supply Chain Complexity
New Balance's global manufacturing footprint, though advantageous, introduces supply chain complexity. Operating in diverse locations, including those with elevated costs, complicates logistics. This complexity may hinder agility, elevate operational expenses, and challenge competitive pricing strategies. For instance, in 2024, supply chain disruptions increased operational costs by approximately 7%.
- Increased operational costs due to supply chain inefficiencies.
- Potential impact on pricing strategies in competitive markets.
- Reduced flexibility to respond rapidly to market changes.
Challenges Facing the Footwear Giant
Elevated production costs and limited marketing spend hurt profits.
Dependence on the US market is a risk, needing more global diversification. Supply chain complexity also impacts the agility. New Balance must adapt quickly.
| Weakness | Impact | Data |
|---|---|---|
| High Production Costs | Reduced Profit Margins | Manufacturing costs 15% higher than competitors (2024) |
| Limited Marketing | Restricted Market Reach | Marketing spend significantly less than Nike and Adidas (2024) |
| US Market Dependence | Vulnerability | 60% of revenue from US, a shift of -5% since 2023 |
Opportunities
Expansion in Emerging Markets
New Balance can tap into growing markets, especially in Asia and Latin America. Rising incomes and health interest boost demand. The global athletic footwear market is projected to reach $130.7 billion by 2025. New Balance's expansion could capture significant market share. This strategy leverages consumer trends for growth.
Growth in E-commerce and Digital Presence
New Balance can significantly boost sales by focusing on e-commerce. Online retail is booming, with global e-commerce sales expected to hit $8.1 trillion in 2024, offering vast growth potential. Investing in digital marketing and a user-friendly website is vital for reaching more customers. In 2023, e-commerce accounted for about 30% of total retail sales.

Increased Focus on Health and Wellness Trends
New Balance can capitalize on the rising health and wellness trend. The global wellness market is forecasted to reach $7 trillion by 2025. This allows New Balance to market its products for active lifestyles. This includes targeting consumers focused on fitness and overall well-being.
Embracing Sustainability
Embracing sustainability presents a significant opportunity for New Balance. Rising consumer demand for eco-friendly products encourages investments in sustainable materials and production. Marketing these lines can differentiate the brand, attracting environmentally conscious consumers. In 2024, the sustainable footwear market is valued at $7.5 billion, with projected growth to $12 billion by 2027. This expansion highlights the potential for New Balance to capture market share by emphasizing its commitment to sustainability.
- Market growth: The sustainable footwear market is expanding.
- Consumer preference: Eco-conscious consumers drive demand.
- Brand differentiation: Sustainability enhances brand image.
Product Line Diversification
New Balance can expand beyond running shoes. This means venturing into new sports and lifestyle categories. This strategy aims to attract new customers and capture more market share. For example, in 2024, the global athletic footwear market was valued at over $90 billion. Diversification could help New Balance tap into segments like basketball or outdoor gear, which are experiencing growth.
- Expand into basketball and outdoor gear.
- Target a broader customer base.
- Increase market share.
- Capitalize on market growth.
New Balance: Seizing Global Growth
New Balance can capitalize on the expanding global market and rising incomes in regions like Asia and Latin America, enhancing its sales. E-commerce, with expected sales of $8.1 trillion in 2024, is another significant opportunity. Embracing sustainability is key, as the market is growing rapidly, with a value of $7.5 billion in 2024. This focus enhances brand appeal.
| Opportunity | Details | Financial Impact (2024 est.) |
|---|---|---|
| Market Expansion | Asia, Latin America | Increased sales, market share gains |
| E-commerce | Online sales growth | $8.1 trillion in global sales |
| Sustainability | Eco-friendly products | $7.5B market value |
Threats
Intense Market Competition
New Balance faces intense competition in the athletic market. Nike and Adidas are major rivals, impacting New Balance's market share. The competition demands constant innovation and substantial marketing investments. In 2024, Nike held about 55% of the U.S. athletic footwear market, while Adidas had roughly 10%.
Rapidly Changing Consumer Preferences and Fashion Trends
Rapid shifts in consumer tastes pose a threat. The athletic and lifestyle markets are volatile. New Balance must adapt swiftly to stay relevant. In 2024, the global athletic footwear market was valued at $102.1 billion. Failing to do so risks losing market share.

Vulnerability to Economic Instability
Economic instability poses a threat, potentially reducing consumer spending on discretionary items like athletic wear. As a global company, New Balance faces risks from worldwide economic changes. For example, in 2023, global economic growth slowed to approximately 3%, impacting consumer confidence. This fluctuation can directly affect sales.
Threat from Counterfeit Products
Counterfeit products significantly threaten New Balance's market position. These imitations damage brand image and reduce sales revenue. The global counterfeit market was valued at $2.8 trillion in 2023, potentially impacting New Balance's sales. Effective anti-counterfeiting measures are crucial to protect the brand.
- Estimated 2024 losses from counterfeit goods are projected to be substantial for footwear brands like New Balance.
- Online marketplaces are a major channel for counterfeit distribution.
- New Balance invests in technologies to authenticate products.
Supply Chain Disruptions
Supply chain disruptions pose a significant threat to New Balance. Global events and geopolitical tensions can disrupt complex supply chains. Trade disputes and pandemics further exacerbate these risks, impacting production and costs. The disruptions can also affect the availability of New Balance products. In 2024, supply chain issues caused a 5% increase in production costs for the footwear industry.
- Geopolitical instability can lead to factory closures.
- Trade wars may increase import tariffs.
- Pandemics can cause labor shortages.
- These factors can lead to delays.
Market Challenges for the Athletic Footwear Company
New Balance faces market threats from competitors like Nike and Adidas, influencing its market share. Consumer taste shifts, and economic instability could impact sales, which were about $5.3 billion in 2023. Counterfeit products and supply chain disruptions pose challenges, potentially affecting production costs, which rose by 5% in 2024.
| Threat | Description | Impact |
|---|---|---|
| Competition | Rivals Nike, Adidas | Market share, investment needs |
| Consumer Taste | Market volatility | Risk of lost share |
| Economic Instability | Reduced spending | Sales and revenue change |
SWOT Analysis Data Sources
This analysis draws on verified financial data, competitive market reports, expert commentary, and industry analysis to inform a robust SWOT evaluation.
