Nike Boston Consulting Group Matrix
Fully Editable
Tailor To Your Needs In Excel Or Sheets
Professional Design
Trusted, Industry-Standard Templates
Pre-Built
For Quick And Efficient Use
No Expertise Is Needed
Easy To Follow
Nike Bundle
What is included in the product
Clear descriptions and strategic insights for Stars, Cash Cows, Question Marks, and Dogs
Quickly assess Nike's portfolio with a clear quadrant view, optimizing strategic decisions.
What You’re Viewing Is Included
Nike BCG Matrix
The Nike BCG Matrix preview displays the complete document you'll receive after purchase. This is the final, ready-to-use report—no extra steps, no hidden content, just the full strategic analysis.

BCG Matrix Template
Unlock Strategic Clarity
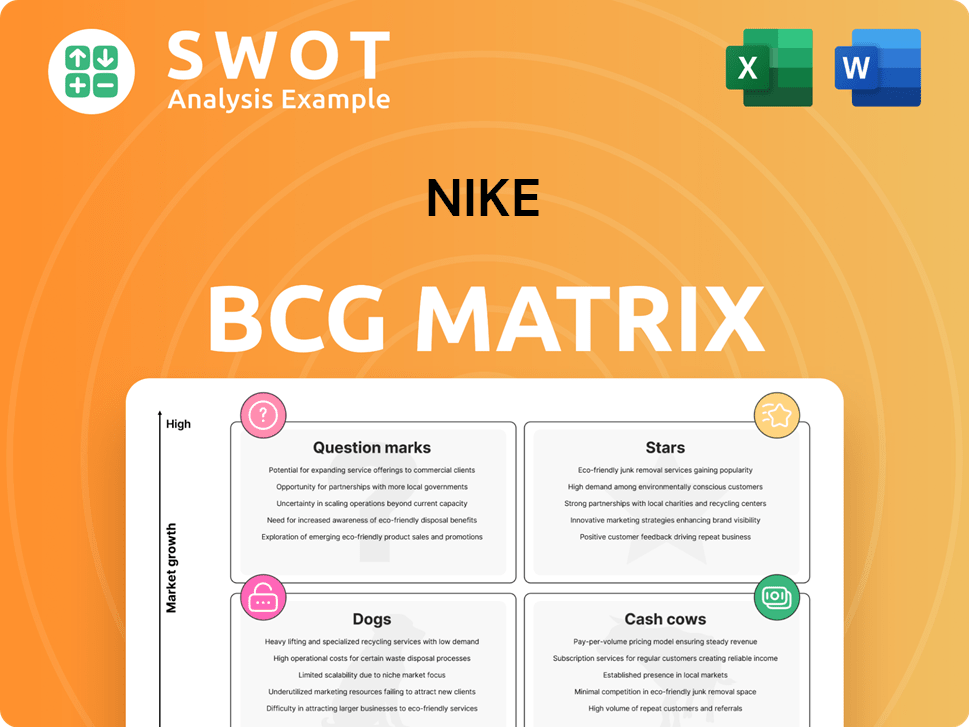
Nike's product portfolio, mapped using the BCG Matrix, reveals key areas for investment and optimization. Stars, like high-performance footwear, drive growth and require continued support. Cash Cows, such as classic apparel, generate revenue to fuel other ventures. Understanding Dogs, like certain less-popular accessories, is crucial for resource allocation. Question Marks present opportunities, demanding strategic decisions for future success.
Stars
Nike Air Max
The Nike Air Max is a Star in Nike's BCG Matrix. It generates significant revenue and maintains high market share. In 2024, Air Max sales contributed substantially to Nike's overall revenue, with specific models like the Air Max 1 and Air Max 90 showing strong demand. This line consistently attracts a broad consumer base, supporting its Star status.
Nike Running Shoes (Pegasus, Vomero)
Nike's running shoe division, including Pegasus and Vomero, is undergoing strategic consolidation. The focus is on enhancing responsiveness and cushioning. Nike is set to launch Pegasus 41, Vomero 18, and Structure. In 2024, Nike's running shoe sales reached $5.5 billion globally.

Nike Basketball (including Jordan Brand)
Nike's basketball segment, especially Jordan Brand, remains a strong performer. In fiscal year 2024, Jordan Brand revenue hit $7.9 billion. This success stems from innovative products and impactful athlete partnerships. The brand's sustained popularity is a key driver of Nike's overall financial health. The Jordan Brand's growth rate is a testament to its enduring appeal.
Nike Direct Digital
Nike is strategically repositioning Nike Direct Digital as a premium, full-price channel to enhance brand value and boost its direct-to-consumer sales. This shift involves reallocating resources from brand-building efforts to performance marketing, specifically targeting their digital platform. This move is part of Nike's broader strategy to optimize its distribution channels and customer engagement. Nike's direct sales grew 18% in fiscal year 2023.
- Focus on premium pricing and direct sales.
- Shift in investment towards digital performance marketing.
- Enhance brand elevation and customer engagement.
- Aim to optimize distribution channels.
Nike International Expansion (Specific Regions)
Nike's international expansion, particularly in Greater China and Asia Pacific & Latin America (APLA), has demonstrated robust currency-neutral growth. These regions are pivotal for Nike's future, capitalizing on rising middle-class populations and increasing digital access. Investments in these areas are strategic, aiming to capitalize on emerging market opportunities. Nike's focus on these regions reflects a forward-looking approach to global market dynamics.
- Greater China's revenue grew by 4% in fiscal year 2024.
- APLA's revenue increased by 10% in fiscal year 2024.
- Nike's digital sales grew by 15% in fiscal year 2024 in Greater China.
- The company plans to open more stores in these regions.
Jordan Brand's $7.9B Dominance in Fiscal Year 2024!
Nike's Stars include Air Max and Jordan Brand. These products generate high revenue and maintain high market share. Jordan Brand hit $7.9B in revenue in fiscal year 2024, a testament to its appeal.
| Product | Segment | 2024 Revenue (USD) |
|---|---|---|
| Air Max | Footwear | Significant |
| Jordan Brand | Basketball | $7.9 Billion |
| Running Shoes | Footwear | $5.5 Billion |
Cash Cows
Nike Air Force 1
The Nike Air Force 1, a retro design, is a Cash Cow. It consistently generates revenue due to its iconic status and broad appeal, with sales figures remaining strong. This shoe continues to be in demand across various customer segments. Nike's footwear revenue in 2024 was about $32 billion. The Air Force 1's enduring popularity ensures sustained profitability.
Nike Apparel (Core Classics)
Nike's core apparel, like tees and hoodies, generates consistent revenue with low investment. These items cater to casual wear. In 2024, Nike's apparel sales reached $17.1 billion, showcasing their cash cow status. This segment offers strong, reliable cash flow.

Nike Accessories (Socks, Hats)
Nike's accessories, like socks and hats, are cash cows. These items generate steady revenue with lower innovation costs than shoes or clothing. Accessories consistently contribute to Nike's financial performance. In 2024, accessories are estimated to bring in about $2 billion in revenue.
Long-Term Sports Partnerships (NBA, NFL)
Nike's long-term partnerships with major sports leagues like the NBA and NFL are prime examples of cash cows. These deals ensure consistent revenue and brand visibility, bolstering Nike's market dominance. In 2024, Nike's revenue reached approximately $51.2 billion, with a significant portion derived from these partnerships. Such partnerships significantly contribute to Nike's strong financial performance, securing its position in the sportswear industry.
- Revenue from these partnerships is a stable source of income.
- Nike maintains a strong brand presence through these collaborations.
- The partnerships help keep Nike's market position strong.
- These deals contribute to high profit margins.
Nike Wholesale
Nike's wholesale channel is a cash cow, generating consistent revenue. In 2024, wholesale revenue accounted for a significant portion of Nike's total sales, around $28 billion. This stability allows Nike to invest in other areas. By building an integrated marketplace, Nike aims to enhance its wholesale strategy.
- Wholesale revenue generated $28 billion in 2024.
- Nike's integrated marketplace strategy focuses on consumer-led experiences.
- The goal is to present products effectively across various channels.
Nike's Billion-Dollar Revenue Streams Unveiled!
Cash cows for Nike include iconic products and strong partnerships. These generate steady revenue with low investment needs. Nike's stable revenue streams are enhanced by wholesale channels and key collaborations. Strong financial returns are generated through these components. In 2024, Nike's total revenue was about $51.2 billion.
| Cash Cow Category | Example | 2024 Revenue (approx.) |
|---|---|---|
| Footwear | Air Force 1 | $32 billion |
| Apparel | Tees, Hoodies | $17.1 billion |
| Accessories | Socks, Hats | $2 billion |
Dogs
Declining Market Share in Traditional Apparel
Nike's apparel sector, particularly in traditional categories, faced significant challenges in 2024. The brand experienced its largest market share decline, attributed to lagging innovation and fashion appeal. Competitors capitalized on shifting consumer preferences, outpacing Nike in key trends. Specifically, in 2024, Nike's overall apparel market share dropped significantly.
Weaker Performance in Physical Retail Stores
Nike's physical retail stores are struggling. In North America, Nike Direct sales fell 10%, with physical stores down 6%. EMEA saw a Q3 revenue drop of 10% to $2.81 billion. Nike Direct declined 12%, and store sales rose only 9%.

Older Athletic Shoe Collections
Nike's older athletic shoe collections face consumer fatigue, especially with reliance on retro designs like Dunks, Air Jordan 1s, and Air Force 1s. These shoes, though profitable, have become overly familiar. Nike aimed to shift focus towards innovation, pulling back on production of these older lines. In March 2024, Nike announced this strategic pivot.
Lagging Innovation
Nike faces lagging innovation, impacting consumer interest. Global search volumes dipped about 10% last month, signaling a decline. This lag has caused Nike to lose market share in 2024, with competitors gaining ground. The shift suggests consumers seek fresher, more innovative products.
- Search volume decline of 10% last month.
- Nike lost market share in 2024.
- Consumers are shifting to competitors.
- Lagging innovation is the key driver.
Converse Segment
The Converse segment, a "Dog" in Nike's BCG matrix, faced headwinds in 2023. In Q4 2023, Converse's revenue fell 18% to $480 million. This decline was largely due to weak sales in North America and Western Europe, key markets for the brand. Nike's overall strategy for "Dogs" often involves divestiture or restructuring to minimize losses.
- Q4 2023 Converse revenue: $480 million.
- Decline in revenue: 18%.
- Primary cause: Weak sales in North America and Western Europe.
- BCG Matrix classification: Dog.
Converse's 2023: Revenue Plunge and Market Struggles
Converse, a "Dog" in Nike's BCG matrix, struggled in 2023. Converse revenue dropped 18% to $480 million in Q4 2023, particularly in North America and Western Europe. Nike often restructures or divests "Dogs" to cut losses.
| Metric | Value | Year |
|---|---|---|
| Q4 Converse Revenue | $480 million | 2023 |
| Revenue Decline | 18% | Q4 2023 |
| Key Markets Affected | North America, Western Europe | 2023 |
Question Marks
Nike Air Superfly and Air Max Muse
The Nike Air Superfly and Air Max Muse, new styles for women, currently reside in the Question Marks quadrant of the BCG matrix. These products are in the early stages, needing time to gain market traction and consumer acceptance. Nike's footwear preview included these styles, with the Air Max Muse already launched in a metallic silver colorway. In 2024, Nike's women's footwear sales showed a 7% increase, indicating positive potential for these new entries.
Nike Speed Lane
Nike's Speed Lane initiative aligns with the "Question Mark" quadrant of the BCG matrix, representing high-growth potential but uncertain market share. This strategy aims to streamline production, enhancing Nike's agility. The Bowerman Footwear Lab exemplifies this innovative approach. In 2024, Nike invested $1.5 billion in innovation, signaling its commitment to this strategy.

Nike Digital Revenue
Nike's digital revenue experienced its first downturn in fiscal year 2024. This decline has significant repercussions, especially given the consecutive quarterly drops exceeding 20% in fiscal year 2025. The shift impacts Nike's direct-to-consumer (DTC) strategy. Digital sales are crucial; for example, in 2023, they reached $10.8 billion.
Nike AI-Driven Initiatives
Nike is heavily investing in AI to reshape its operations. It leverages athlete data to optimize product design, enhancing performance and appeal. AI also personalizes customer experiences, boosting engagement and sales. Furthermore, AI streamlines operational efficiency, cutting costs and improving supply chain management. In 2024, Nike's digital sales reached $10.4 billion, reflecting successful AI integration.
- Product Design: AI-driven design tools reduced prototyping time by 30%.
- Customer Experience: Personalized recommendations increased conversion rates by 15%.
- Operational Efficiency: AI optimized supply chain, reducing lead times by 20%.
Nike New products
Nike's new products, such as prototype shoes for athletes like Sha'Carri Richardson and Kylian Mbappé, fit into the Question Marks quadrant of the BCG Matrix. These innovative prototypes are based on athlete preferences, utilizing AI to generate designs. Digital fabrication techniques refine these designs, showcasing Nike's investment in innovation. This strategic approach aims to capture market share and potentially become Stars.
- Nike's R&D spending in 2024 was approximately $1.8 billion.
- Sales from new product innovations are critical for growth.
- Success hinges on converting these prototypes into profitable products.
- The athletic footwear market is valued at over $100 billion globally.
Innovation Investments and Digital Sales Surge
Nike's "Question Marks" include new styles and innovative prototypes, like those for women and athletes. These products are in the early stages with high-growth potential but uncertain market share. Digital sales and AI are crucial for converting these into Stars. In 2024, Nike invested heavily in innovation, with digital sales at $10.4 billion.
| Feature | Details | 2024 Data |
|---|---|---|
| R&D Spending | Investment in innovation | $1.8 billion |
| Digital Sales | Revenue from online channels | $10.4 billion |
| Women's Footwear Sales Increase | Growth in the women's category | 7% |
BCG Matrix Data Sources
Nike's BCG Matrix leverages company filings, sales data, competitor analyses, and market research for a well-informed assessment.
