Nike Porter's Five Forces Analysis
Fully Editable
Tailor To Your Needs In Excel Or Sheets
Professional Design
Trusted, Industry-Standard Templates
Pre-Built
For Quick And Efficient Use
No Expertise Is Needed
Easy To Follow
Nike Bundle
What is included in the product
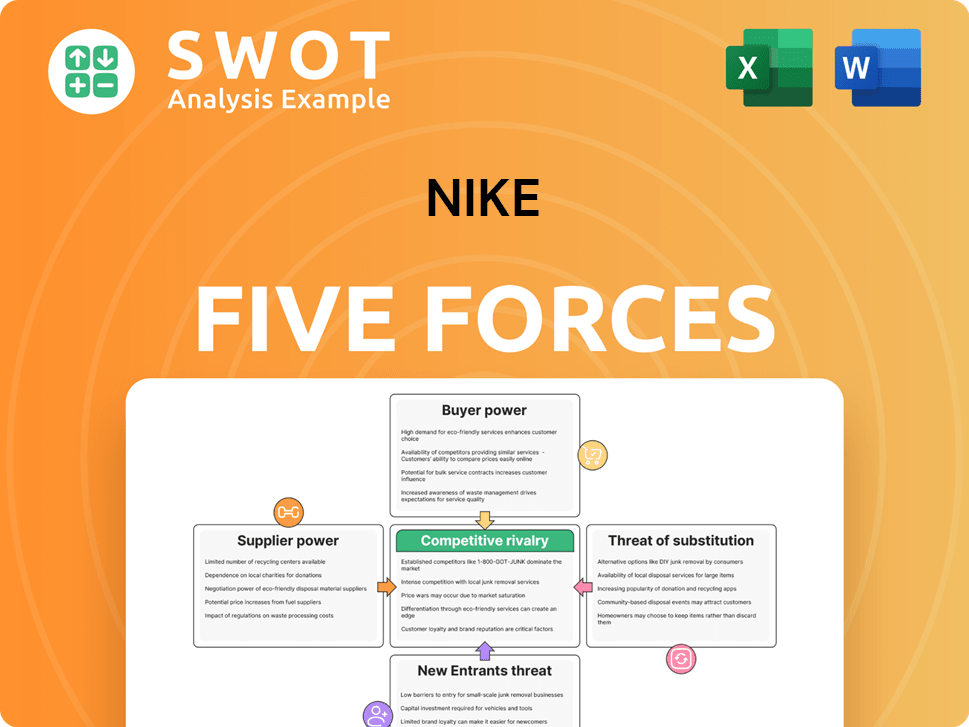
Analyzes Nike's competitive forces, including supplier/buyer power & threat of new entrants.
Identify threats to your market position with an automated force-level color-coding system.
Preview Before You Purchase
Nike Porter's Five Forces Analysis
This preview shows the exact document you'll receive immediately after purchase—no surprises, no placeholders. This Nike Porter's Five Forces analysis examines competitive rivalry, supplier power, and more. See how the brand navigates buyer power and threats of new entrants, and substitutes. This comprehensive file is ready for instant download!

Porter's Five Forces Analysis Template
Don't Miss the Bigger Picture
Nike faces a dynamic competitive landscape, shaped by Porter's Five Forces. The threat of new entrants is moderate, countered by high brand loyalty. Supplier power is somewhat limited due to Nike's size. Buyer power fluctuates depending on retail channels and consumer trends. Rivalry among existing competitors, like Adidas, is intense. The threat of substitutes, particularly athletic apparel, is a constant consideration.
This brief snapshot only scratches the surface. Unlock the full Porter's Five Forces Analysis to explore Nike’s competitive dynamics, market pressures, and strategic advantages in detail.
Suppliers Bargaining Power
Limited Supplier Power
Nike's supplier power is limited. The abundance of sporting goods manufacturing resources globally weakens suppliers' influence. In 2024, Nike sourced from approximately 700 factories. This vast supply chain and supplier diversification allow for competitive pricing and favorable terms.
Supplier Concentration
Nike's supplier market is unconcentrated, boosting its negotiation power. Nike's massive buying volume helps it get better rates. In 2024, Nike spent billions on materials, showing its leverage. This limits supplier influence, keeping costs down. Nike's strategy ensures competitive pricing.

Numerous Suppliers
Nike benefits from numerous athletic wear suppliers, weakening their bargaining power. This competitive landscape, with options like contract manufacturers in Asia, limits supplier leverage. Nike can readily switch suppliers, maintaining cost control and supply chain flexibility. In 2024, Nike's supply chain costs were approximately $20 billion, highlighting its ability to negotiate favorable terms.
Long-Term Relationships
Nike's long-term supplier relationships significantly bolster its competitive edge. These partnerships guarantee a consistent supply of premium materials, reducing potential supply chain disruptions. This strategic approach diminishes the bargaining power of suppliers, allowing Nike to maintain control over costs and quality. In 2024, Nike's supply chain resilience was evident in its ability to navigate global economic challenges.
- Nike's long-term contracts with suppliers often include clauses that lock in prices and supply volumes.
- By spreading its sourcing across multiple suppliers, Nike further mitigates the risk of over-reliance on any single entity.
- Nike's investments in supplier training and development programs help improve their capabilities.
Raw Material Availability
Nike's bargaining power with suppliers is generally strong due to the availability of raw materials. Raw materials like cotton, leather, and rubber are sourced globally. This widespread availability limits the ability of any single supplier to exert significant control over pricing or terms. Nike can switch suppliers if needed, maintaining its negotiating leverage.
- Cotton prices in 2024 have been relatively stable.
- Leather prices have fluctuated, but alternatives exist.
- Rubber prices are influenced by global demand, but diverse sources are available.
- Nike's diversified sourcing strategy mitigates supplier power.
Supplier Dynamics: A Look at Costs and Contracts
Nike's supplier power is weak due to its large-scale sourcing and global supplier base. It uses its size to negotiate favorable terms and pricing. Diversification and long-term contracts ensure supply chain stability and cost control. In 2024, Nike's cost of sales was approximately $25 billion.
| Factor | Impact | Data (2024) |
|---|---|---|
| Supplier Concentration | Low | 700+ factories |
| Raw Material Availability | High | Cotton, leather, rubber |
| Supplier Relationships | Long-term contracts | Cost of Sales: ~$25B |
Customers Bargaining Power
Moderate Buyer Power
Nike faces moderate buyer power. Switching costs are low to moderate for consumers, giving them some leverage. Consumers can easily find information and compare options, affecting Nike's pricing. In 2024, Nike's revenue reached $51.2 billion, showing its sensitivity to consumer choices.
Substitute Availability
The availability of substitutes moderately impacts customer bargaining power. Consumers can choose from various alternatives like Adidas or Under Armour. In 2024, the global athletic footwear market was valued at approximately $95 billion. This competition pressures Nike to offer competitive pricing.

Low Buyer Concentration
Nike benefits from low buyer concentration because its customer base is vast and varied. This fragmentation prevents any single customer or group from dictating terms. In 2024, Nike's revenue was spread across millions of consumers globally. The brand's widespread appeal and diverse product offerings further dilute buyer power, offering it stability.
Price Sensitivity
Customers' price sensitivity is a significant factor in the competitive landscape, especially given the availability of alternative brands and generic options. Nike, despite its strong brand, faces this pressure, as consumers can easily switch to less expensive competitors. While Nike invests heavily in marketing to build brand loyalty, price remains a crucial factor influencing consumer decisions. For instance, in 2024, Nike's gross margin was around 44.8%, reflecting the balancing act between premium pricing and consumer price sensitivity.
- Price is a key factor for many consumers.
- Nike's brand loyalty helps, but alternatives exist.
- Marketing plays a crucial role in mitigating price sensitivity.
- Nike's gross margin in 2024 was about 44.8%.
In-Store and E-commerce Access
Customers' power is amplified by easy access to Nike's in-store and online platforms. This dual access broadens their choices, enabling price and product comparisons. Nike's e-commerce sales in fiscal year 2024 reached $10.9 billion, showcasing the impact of digital access. This accessibility allows customers to find better deals, boosting their bargaining strength. This increased customer power necessitates Nike to stay competitive.
- Dual Access: In-store and online.
- Comparison: Easier price and product comparisons.
- E-commerce: $10.9B in fiscal 2024.
- Impact: Strengthens customer bargaining.
Nike's Customer Power: A Deep Dive
Customer bargaining power over Nike is moderate, influenced by low switching costs and accessible information. Alternatives like Adidas pressure Nike on pricing; in 2024, the global footwear market was $95B. Nike's vast customer base dilutes individual buyer impact, but price sensitivity and dual access to sales channels affect consumer strength.
| Factor | Impact | 2024 Data |
|---|---|---|
| Switching Costs | Low to moderate | N/A |
| Market Size | Competition | $95 Billion (Global Footwear) |
| E-commerce Sales | Customer Access | $10.9 Billion |
Rivalry Among Competitors
Intense Competition
The athletic footwear and apparel industry is fiercely competitive, with Nike at the center of it. Nike contends with formidable rivals. Adidas, Puma, Under Armour, ASICS, New Balance, and Lululemon are all fighting for a piece of the market. In 2024, Nike's revenue was approximately $51.2 billion, highlighting the stakes in this competitive landscape.
Marketing Aggressiveness
High marketing aggressiveness is a key feature in the sporting goods industry, fueling intense competition. Nike faces constant pressure to innovate its marketing, with rivals like Adidas and Under Armour investing heavily. In 2024, Nike spent over $4 billion on advertising and promotion, highlighting the need for aggressive marketing to stay competitive. This environment forces Nike to continuously adjust its strategies to maintain its market leadership.

Market Saturation
The athletic footwear market is highly saturated, featuring giants like Nike and Adidas, alongside many smaller competitors. Low market growth rates, around 2-4% annually in recent years, exacerbate rivalry. This means companies fight harder for the same customers, intensifying competition. For example, Nike's revenue in 2024 was $51.2 billion, up from $49.1 billion in 2023, showing modest growth in a crowded space.
Innovation Imperative
Nike's competitive landscape demands relentless innovation. The company must continuously invest in research and development to introduce cutting-edge technologies and designs. This strategy is essential for differentiating products and meeting changing consumer expectations. Failure to innovate could lead to market share loss to rivals like Adidas or Under Armour. In 2024, Nike's R&D spending reached $1.6 billion.
- Nike's R&D investments are crucial for future growth.
- Innovation drives brand loyalty and premium pricing.
- Staying ahead of competitors requires a proactive approach.
- Consumer demand is constantly evolving.
Consumer Loyalty
Consumer loyalty plays a crucial role in Nike's competitive strategy. Low to moderate switching costs mean customers can easily choose competitors. Nike's brand loyalty helps retain customers amid strong rivalry. This is key in a market where competitors offer similar products. Nike's ability to maintain its brand value is essential for success.
- Switching costs for athletic footwear are relatively low, making it easy for consumers to switch brands.
- Nike's brand strength allows it to command a premium price.
- Nike's marketing spend in 2024 was approximately $4 billion, emphasizing brand building.
- Customer retention rates are crucial, given the competitive nature of the industry.
Nike's 2024: Revenue, Rivals, and R&D
Nike faces intense competition, with rivals like Adidas. The company’s aggressive marketing and R&D spending, such as the $1.6 billion on R&D in 2024, are vital. In 2024, Nike's revenue was approximately $51.2 billion, in a market with modest growth.
| Aspect | Details | 2024 Data |
|---|---|---|
| Revenue | Nike's Total Revenue | $51.2B |
| Marketing Spend | Advertising & Promotion | $4B+ |
| R&D Spending | Research & Development | $1.6B |
SSubstitutes Threaten
Moderate Threat
The threat of substitutes for Nike is moderate. Consumers can opt for non-athletic footwear and casual clothing, posing a challenge. This availability of alternatives can decrease Nike's market share. In 2024, the global footwear market was valued at approximately $400 billion, with Nike holding a significant share, but still vulnerable to shifting consumer preferences.
Price-Performance Ratio
Many athletic shoe and apparel substitutes present a solid price-performance ratio. Brands like Adidas and Under Armour compete directly with Nike, offering similar quality at potentially lower prices. In 2024, Adidas's revenue reached approximately $21.4 billion, showcasing strong demand. This value proposition attracts budget-conscious consumers. The availability of these alternatives acts as a threat.

Switching Costs
Switching costs for Nike customers are generally low to moderate. This means consumers can readily choose alternatives. This accessibility elevates the threat from substitutes. For example, Adidas saw a 10% revenue increase in 2024, showcasing the impact of accessible substitutes.
Brand Perception
Fashion-focused brands and tech innovations present a threat to Nike. Nike counters with strategic moves, new products, and strong brand presence. These actions help protect its market share and brand value. In 2024, Nike invested heavily in digital and direct-to-consumer sales, which make up 40% of total revenue, to stay ahead.
- Fashion-forward brands challenge Nike's market position.
- Technological advancements introduce alternative options.
- Nike adapts with product innovations and marketing.
- Brand strength helps defend against substitutes.
Marketing Efforts
Nike actively combats the threat of substitutes through robust marketing strategies and a commitment to superior product quality. Their marketing efforts are designed to build and sustain strong brand recognition and customer loyalty, which in turn diminishes the appeal of alternative brands. Nike's marketing spending in 2024 reached approximately $4 billion, reflecting its significant investment in maintaining brand presence and customer engagement. This substantial investment supports various initiatives, including celebrity endorsements, social media campaigns, and innovative advertising, all of which work to keep Nike top-of-mind for consumers and reinforce its market position.
- Marketing expenditure: Roughly $4 billion in 2024.
- Brand recognition maintained through consistent advertising.
- Customer loyalty driven by high-quality products.
- Use of celebrity endorsements and social media.
Nike's Rivals & Marketing: A Competitive Landscape
The threat of substitutes for Nike is moderate, with consumers having choices. Alternatives include casual wear and competing brands such as Adidas, which saw $21.4B in revenue in 2024. Switching costs are low, so brands must innovate. Nike spent about $4 billion on marketing in 2024.
| Category | Details | 2024 Data |
|---|---|---|
| Substitutes | Alternatives available | Casual wear, Adidas |
| Revenue (Adidas) | Market presence | $21.4 Billion |
| Marketing Spend (Nike) | Brand promotion | $4 Billion |
Entrants Threaten
Moderate Threat
The threat of new entrants to Nike is moderate, with a mix of high and low barriers. High initial capital needs and brand recognition create challenges. However, the rise of e-commerce and direct-to-consumer models lowers some entry barriers. In 2024, Nike's revenue reached $51.2 billion, showcasing its strong brand presence, but smaller online brands are still emerging.
Brand Development Costs
High brand development costs hinder new entrants in the athletic footwear market. Nike spends billions annually on advertising and endorsements. In 2024, Nike's marketing expenses reached $4.0 billion. Building brand recognition requires substantial, ongoing financial commitment.

Economies of Scale
Nike's substantial economies of scale in manufacturing pose a significant barrier to new entrants. Nike's extensive production capabilities and global distribution networks allow it to achieve lower per-unit costs. These lower costs give Nike a competitive pricing advantage, making it hard for newcomers to match prices and gain market share. In 2024, Nike's cost of sales was approximately $28.5 billion, reflecting efficient production.
Access to Distribution
New entrants now have easier access to advertising and distribution, which lowers entry barriers. This makes it simpler for new businesses to reach customers and compete. For instance, digital platforms and social media offer cost-effective advertising options. This trend is evident in the sportswear market. In 2024, online sales accounted for a significant portion of the industry's revenue.
- Digital marketing spending increased by 15% in 2024.
- E-commerce sales in the athletic footwear market grew by 12% in 2024.
- Social media advertising costs decreased by 8% in 2024, making it more affordable.
- New brands can partner with established distributors.
Brand Loyalty
Brand loyalty poses a significant threat to new entrants in the athletic apparel market. Nike, with its established brand recognition, benefits from strong customer loyalty. This loyalty makes it challenging for new companies to attract customers. Consumers are less likely to switch to new brands.
- Nike's brand value was estimated at $33.8 billion in 2024.
- Loyal customers often resist switching, creating a barrier.
- New entrants face high marketing costs to build brand awareness.
- Nike's market share in North America was around 56% in 2024.
Nike's Entry Threat: Balancing Barriers and Digital Growth
The threat of new entrants to Nike is moderate due to mixed barriers. While high capital needs and brand loyalty create challenges, e-commerce and digital marketing lower entry costs. In 2024, digital marketing spending rose, and e-commerce sales grew, impacting market dynamics.
| Factor | Impact | 2024 Data |
|---|---|---|
| Capital Needs | High | Nike's marketing expenses: $4.0B |
| Brand Loyalty | High | Nike's brand value: $33.8B |
| Digital Marketing | Lowers barriers | Digital spending up 15% |
Porter's Five Forces Analysis Data Sources
Nike's analysis leverages annual reports, market research, financial statements, and industry news for a comprehensive competitive evaluation.
