Nipro Porter's Five Forces Analysis
Fully Editable
Tailor To Your Needs In Excel Or Sheets
Professional Design
Trusted, Industry-Standard Templates
Pre-Built
For Quick And Efficient Use
No Expertise Is Needed
Easy To Follow
Nipro Bundle
What is included in the product
Analyzes competitive forces, identifying threats & opportunities within Nipro's landscape.
Customize pressure levels based on new data or evolving market trends.
Preview the Actual Deliverable
Nipro Porter's Five Forces Analysis
You're previewing the final, complete Nipro Porter's Five Forces analysis. This document breaks down each force impacting Nipro's competitive landscape. It examines the threat of new entrants, bargaining power of buyers & suppliers, and rivalry. Also, it considers the threat of substitutes. The document you see is what you'll download immediately after purchasing.

Porter's Five Forces Analysis Template
From Overview to Strategy Blueprint
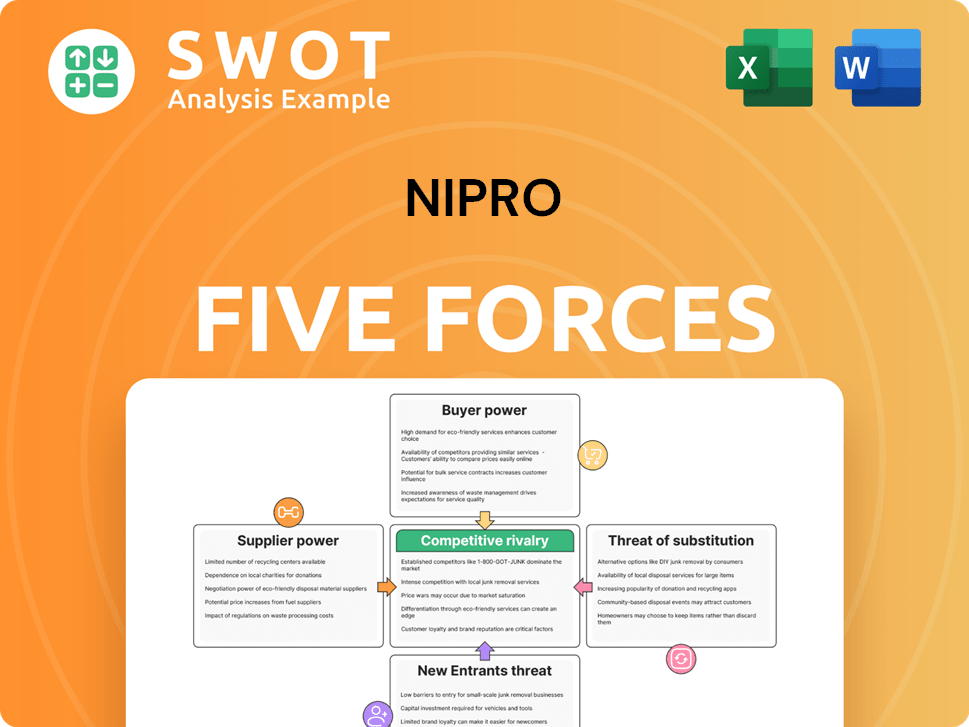
Nipro faces complex industry pressures. Supplier power impacts costs & innovation. Buyer power influences pricing & demand. Threat of new entrants challenges market share. Substitute products pose a risk to revenue streams. Competitive rivalry shapes overall profitability. Ready to move beyond the basics? Get a full strategic breakdown of Nipro’s market position, competitive intensity, and external threats—all in one powerful analysis.
Suppliers Bargaining Power
Supplier Concentration
Supplier power hinges on their concentration. If only a few suppliers provide key components for Nipro's medical devices, they gain substantial bargaining power. For instance, in 2024, the global medical device market was valued at approximately $500 billion, with some component suppliers controlling a significant market share, allowing them to influence pricing and terms, which can impact Nipro's profitability.
Switching Costs for Nipro
Switching costs are vital. High switching costs for Nipro, like those from specialized materials, boost supplier power. Conversely, low switching costs empower Nipro. For instance, in 2024, the medical device industry saw supplier price increases averaging 3-5% due to material shortages, highlighting the impact of switching difficulty. Nipro's ability to find alternative suppliers dictates its ability to control costs.

Supplier's Product Differentiation
The degree of product differentiation significantly impacts supplier bargaining power. Suppliers with unique, specialized offerings wield more influence. For example, in 2024, companies relying on patented components from a single source face higher costs. Conversely, suppliers of generic items have less leverage. This dynamic is evident in the semiconductor industry, where specialized chip manufacturers have greater power than those providing standard materials.
Threat of Forward Integration
Suppliers' threat to integrate forward into Nipro's industry, such as manufacturing medical devices, elevates their bargaining power. This potential shift limits Nipro's ability to negotiate favorable terms on pricing and supply. The risk increases if suppliers possess the resources or technology to compete directly. This dynamic impacts profitability and market positioning.
- Nipro's 2024 revenue: $4.8 billion, highlighting the impact of supplier costs.
- Forward integration could cut into Nipro's gross profit margin, which was 35% in 2023.
- Market research in 2024 shows a 10% rise in supplier-led innovation.
Impact of Input on Nipro's Costs
The bargaining power of suppliers significantly impacts Nipro's cost structure. When a crucial input makes up a large part of Nipro's production expenses, the supplier gains more control. Nipro becomes highly susceptible to any price fluctuations for these essential inputs. For instance, a rise in raw material costs directly impacts Nipro's profitability, especially if these materials are sourced from a limited number of suppliers.
- High input costs can squeeze profit margins.
- Limited supplier options increase vulnerability.
- Dependence on specific suppliers creates risk.
- Price changes directly affect product pricing.
Supplier Dynamics Impacting Costs and Revenue
Supplier concentration and product differentiation affect Nipro's costs. Unique suppliers have more power, which can be seen in the medical device market. High switching costs also bolster supplier power. Conversely, Nipro's 2024 revenue was $4.8 billion, affected by input expenses. The table below shows the impact of supplier power.
| Factor | Impact | 2024 Data |
|---|---|---|
| Concentration | Higher costs | Price hikes: 3-5% |
| Differentiation | Supplier leverage | Innovation rise: 10% |
| Switching costs | Impact on margin | Gross margin: 35% |
Customers Bargaining Power
Buyer Concentration
Buyer concentration is a key factor for Nipro. If a few major hospitals or healthcare systems buy most of Nipro's products, they gain strong negotiating power. These buyers can then push for lower prices or more favorable terms. For instance, in 2024, the top 10 U.S. hospitals accounted for roughly 15% of total healthcare spending. This concentration amplifies their bargaining leverage.
Switching Costs for Buyers
Switching costs are vital for Nipro's customers. If clients like hospitals can readily switch to other medical device or pharmaceutical suppliers, their bargaining power grows. Conversely, high switching costs benefit Nipro. In 2024, the medical device market saw intense competition, highlighting the importance of customer loyalty. For instance, companies with strong product differentiation and service offerings, like Nipro, could command higher prices.

Buyer's Price Sensitivity
Buyer price sensitivity significantly shapes customer bargaining power. High price sensitivity, often driven by budget limits or competition, amplifies pressure on Nipro to cut prices. Conversely, reduced price sensitivity weakens customer bargaining power. For instance, in 2024, healthcare providers, a major customer segment, faced cost pressures, influencing their negotiation tactics. Lower price sensitivity reduces the impact of customers on prices.
Availability of Information
The availability of information significantly influences buyer power in the medical device industry. If customers have detailed insights into Nipro's costs, product performance, and competitor offerings, their ability to negotiate improves. Transparency, facilitated by online platforms and regulatory disclosures, empowers buyers. For instance, in 2024, the global market for medical devices was valued at approximately $500 billion, with information readily accessible. This easy access to data increases buyer leverage.
- Price Comparison: Buyers can easily compare Nipro's prices with competitors.
- Performance Data: Access to product performance metrics helps buyers assess value.
- Supplier Information: Buyers can research and identify alternative suppliers.
- Regulatory Compliance: Information on regulatory standards impacts buyer decisions.
Buyer Threat of Backward Integration
Consider the scenario of buyers integrating backward. If major hospital chains or healthcare providers could start making their own medical devices or pharmaceuticals, it significantly boosts their bargaining power, which in turn reduces Nipro's ability to set its prices. This poses a real threat, especially if these large buyers have the resources and expertise to produce similar products. For instance, in 2024, the global medical devices market was valued at approximately $550 billion, with hospital groups accounting for a significant portion of the purchasing power.
- Backward integration by buyers can squeeze profit margins.
- Large buyers have the capital to set up manufacturing.
- This shifts the balance of power in negotiations.
- It limits Nipro's pricing and market control.
Customer Power Dynamics: Impact on Profitability
Customer bargaining power significantly impacts Nipro's profitability, particularly in the competitive medical device market. Concentrated buyers and readily available product information strengthen customers' ability to negotiate favorable terms.
Switching costs and price sensitivity also influence customer leverage, with price-conscious buyers seeking cost-effective solutions. The threat of backward integration further challenges Nipro's market control and pricing strategies.
In 2024, the global medical device market was valued around $550 billion, underlining the importance of managing customer relationships and competitive pressures.
| Factor | Impact on Nipro | 2024 Data |
|---|---|---|
| Buyer Concentration | High concentration increases buyer power. | Top 10 U.S. hospitals: ~15% healthcare spend. |
| Switching Costs | Low switching costs increase buyer power. | Medical device market size: ~$550 billion. |
| Price Sensitivity | High sensitivity increases buyer power. | Healthcare cost pressures influence negotiations. |
Rivalry Among Competitors
Number of Competitors
The medical device and pharmaceutical sectors see many competitors. High numbers boost rivalry. This can mean price cuts, marketing fights, and new products. In 2024, the global medical devices market reached $500 billion. This competition affects Nipro's earnings.
Industry Growth Rate
The industry growth rate significantly impacts competitive rivalry. Slow growth often intensifies competition as firms vie for limited market share. For example, the global medical devices market, projected to reach $683.3 billion in 2024, experiences moderate growth, thus increasing rivalry.

Product Differentiation
Product differentiation significantly impacts competitive rivalry. If Nipro's products stand out with unique features, rivalry lessens. Conversely, commodity-like products intensify price competition. In 2024, companies with innovative products like Novo Nordisk (diabetes treatments) saw robust growth, while those with less differentiated offerings faced pricing pressures. For example, the global medical device market was valued at $455.6 billion in 2023 and is projected to reach $630.4 billion by 2028.
Switching Costs for Customers
Switching costs significantly influence competitive rivalry. High switching costs can lessen rivalry because customers are less inclined to change vendors. Conversely, low switching costs intensify rivalry, as customers can readily move to competitors. For example, the average churn rate in the SaaS industry, where switching costs can be low, was around 13% in 2024, reflecting high rivalry. This contrasts with industries like telecom, where contract penalties create higher switching costs and lower churn rates.
- High switching costs decrease rivalry; low switching costs increase it.
- SaaS industry churn rate was about 13% in 2024.
- Telecom has lower churn due to higher switching costs.
Exit Barriers
Exit barriers significantly influence competitive rivalry within an industry. High exit barriers, such as specialized equipment or long-term contracts, can keep companies competing even when profits are low, intensifying rivalry. Conversely, low exit barriers enable firms to exit the market more easily, potentially reducing overcapacity and easing competitive pressures. For instance, in the airline industry, high exit costs (aircraft ownership, lease agreements) contribute to fierce competition. In 2024, several airlines faced financial difficulties, yet struggled to exit due to these constraints.
- High exit barriers lead to intense rivalry.
- Low exit barriers reduce competitive pressure.
- Specialized assets increase exit barriers.
- Contractual obligations also increase exit barriers.
Medical Sector's Competitive Landscape: Key Factors
Competitive rivalry in the medical sector is fierce, fueled by numerous competitors. Growth rates and product differentiation significantly affect competition levels. High switching costs and exit barriers can influence the intensity of rivalry.
| Factor | Impact on Rivalry | Example (2024 Data) |
|---|---|---|
| Number of Competitors | High numbers increase rivalry | Over 7,000 medical device firms globally |
| Industry Growth | Slow growth intensifies rivalry | Medical device market growth at ~7% |
| Product Differentiation | Differentiated products lessen rivalry | Novo Nordisk (diabetes) strong growth |
| Switching Costs | High costs decrease rivalry | Telecom contract penalties |
SSubstitutes Threaten
Availability of Substitutes
The availability of substitutes is a key threat in Porter's Five Forces. Nipro faces this, as alternative treatments or less invasive procedures can replace its medical devices. A broad array of substitutes heightens this threat, potentially reducing demand. In 2024, the market for medical devices saw growing competition from less invasive options, reflecting this dynamic.
Relative Price Performance
The relative price performance of substitutes is crucial for Nipro. If alternatives provide comparable performance at a lower cost, they become more appealing. Nipro must ensure its pricing is competitive compared to substitutes. For example, in 2024, generic drug prices have seen fluctuations, impacting branded drug sales. Understanding these price dynamics is vital for Nipro's market positioning. Nipro must justify its pricing strategy considering the availability and cost of alternatives.

Switching Costs to Substitutes
Switching costs to substitutes are crucial in assessing the threat they pose. If customers face low costs to switch, the threat of substitutes rises significantly. High switching costs, however, protect a company. For example, in 2024, companies with strong brand loyalty often have higher switching costs, reducing the risk from competitors.
Buyer Propensity to Substitute
The buyer's willingness to switch to alternatives significantly shapes the threat of substitutes. If customers easily find acceptable replacements, this threat increases. Strong brand loyalty and high perceived quality often decrease this propensity. For example, in 2024, generic drugs posed a substantial threat to branded pharmaceuticals due to their lower prices. This is a critical consideration in market analysis.
- The ease of finding substitutes directly impacts the threat level.
- Brand loyalty acts as a barrier, reducing the likelihood of substitution.
- Perceived quality influences buyers' willingness to switch.
- In 2024, the generic drug market grew by 8%, highlighting the impact of substitutes.
Innovation in Other Fields
Innovation in related fields poses a threat to Nipro through the potential for new substitutes. For instance, breakthroughs in regenerative medicine might offer alternatives to some of Nipro's medical products. Constant vigilance over technological progress is essential for anticipating these shifts. The medical devices market was valued at $580.63 billion in 2023, with projections to reach $858.09 billion by 2030, indicating significant innovation potential.
- Regenerative medicine market is projected to reach $103.2 billion by 2028.
- Nipro's revenue for fiscal year 2024 was approximately $5.5 billion.
- The global dialysis market is expected to reach $120.1 billion by 2030.
- Nipro has increased its R&D spending by 7% in the last year.
Substitutes Challenge Nipro's Market Position
The threat of substitutes significantly affects Nipro. Less expensive alternatives can undermine Nipro's market share. High switching costs and strong brand loyalty can lessen this threat. In 2024, market trends showed increased competition from generics.
| Factor | Impact on Nipro | 2024 Data |
|---|---|---|
| Price of Substitutes | Competitive pricing needed | Generic drug sales up 8% |
| Switching Costs | Influences customer choice | Brand loyalty reduces switching |
| Buyer Willingness | Directly impacts threat level | Dialysis market at $120.1B by 2030 |
Entrants Threaten
Barriers to Entry
Barriers to entry are crucial for assessing new entrant threats. High barriers, like substantial capital or strict regulations, protect existing firms. For example, in 2024, pharmaceutical companies face significant FDA approval costs. Conversely, low barriers amplify the threat.
Economies of Scale
Economies of scale are vital. If existing companies like Nipro have large-scale benefits, new entrants struggle with costs, acting as a barrier. For example, Nipro's global operations and manufacturing capacity give it a cost advantage. This makes it harder for new businesses to enter the market successfully. This reduces the threat from newcomers.

Product Differentiation
Product differentiation significantly influences the threat of new entrants. If Nipro's offerings are unique and customers are loyal, new competitors face a tough challenge. However, if Nipro's products are seen as commodities, the barrier to entry is much lower. In 2024, companies with strong brand recognition saw higher customer retention rates, making it harder for new entrants to compete. For example, companies with strong product differentiation saw a 20% higher profit margin.
Access to Distribution Channels
Access to distribution channels is crucial for Nipro Porter's success. If established competitors have strong ties and control distribution, new entrants face hurdles in reaching customers. This limited access significantly raises the barrier to entry. Consider that in the pharmaceutical industry, securing distribution can take years and cost millions. This is especially true for specialized products.
- Distribution costs can constitute up to 30% of total product costs.
- Established companies often have exclusive distribution agreements.
- New entrants may need to build their distribution networks.
- Lack of access can prevent market penetration.
Government Policy
Government policies and regulations significantly influence the threat of new entrants. Stringent regulations, such as those enforced by the FDA in the U.S. or the EMA in Europe, can create high barriers to entry, especially for medical device and pharmaceutical companies like Nipro. Lengthy and complex approval processes, as seen with new drug approvals, deter potential entrants. Conversely, favorable policies, such as tax incentives or streamlined approval pathways, can encourage new entrants into the market.
- FDA approvals for medical devices can take several years and cost millions of dollars.
- The EMA's regulatory framework also requires extensive clinical trials and data submissions.
- Tax incentives for research and development can lower the barrier to entry.
Market Entry Hurdles: A Look at the Barriers
The threat of new entrants affects Nipro's market position. High barriers like capital needs and regulations protect incumbents. In 2024, strong brands saw higher customer retention rates. Low barriers and commodity products increase entry risks.
| Barrier Type | Impact on Entry | Example (2024 Data) |
|---|---|---|
| Capital Requirements | High Barrier | Pharma R&D: $2.6B average cost |
| Product Differentiation | Low Barrier | Commodity products face intense competition |
| Access to Distribution | High Barrier | Distribution costs: up to 30% of costs |
Porter's Five Forces Analysis Data Sources
The Nipro analysis leverages company reports, financial statements, industry analyses, and market share data for each force assessment. Publicly available information is key.
