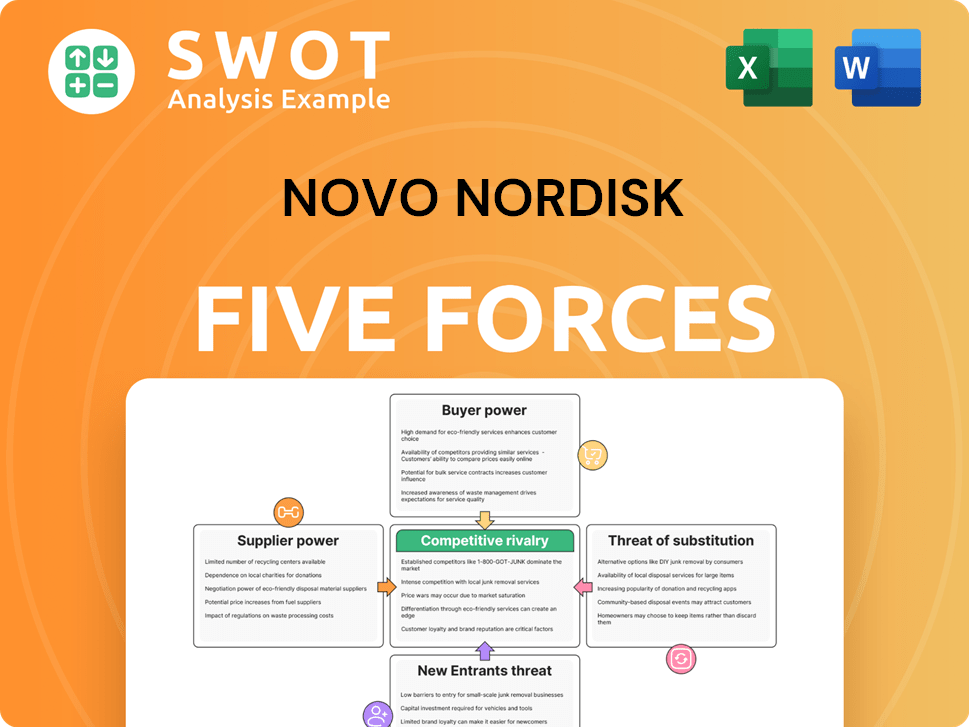
Novo Nordisk Porter's Five Forces Analysis
Fully Editable
Tailor To Your Needs In Excel Or Sheets
Professional Design
Trusted, Industry-Standard Templates
Pre-Built
For Quick And Efficient Use
No Expertise Is Needed
Easy To Follow
Novo Nordisk Bundle
What is included in the product
Analyzes Novo Nordisk's competitive forces: rivalry, suppliers, buyers, threats, and entry barriers.
Swap in your own data, labels, and notes to reflect current business conditions.
Full Version Awaits
Novo Nordisk Porter's Five Forces Analysis
This preview delivers the complete Porter's Five Forces analysis of Novo Nordisk. You're seeing the final, ready-to-use document; there's nothing else. Upon purchase, you'll download this exact analysis immediately.

Porter's Five Forces Analysis Template
Go Beyond the Preview—Access the Full Strategic Report
Novo Nordisk faces intense competition in the diabetes and obesity markets. Buyer power is moderate, influenced by insurance providers and healthcare systems. The threat of substitutes, particularly from emerging weight-loss drugs, is increasing. Supplier power is relatively low due to the nature of pharmaceutical supply chains. Competitive rivalry is high with established players and new entrants vying for market share.
This brief snapshot only scratches the surface. Unlock the full Porter's Five Forces Analysis to explore Novo Nordisk’s competitive dynamics, market pressures, and strategic advantages in detail.
Suppliers Bargaining Power
Supplier Diversity
Novo Nordisk's supplier diversity is a key strength. They use a diverse base for raw materials and services, which boosts their negotiation power. This approach ensures supply chain stability. In 2024, they likely maintained this strategy, avoiding dependence on any single supplier.
Quality and Compliance
Suppliers for Novo Nordisk face strict quality and regulatory demands. The limited number of suppliers meeting these high standards could elevate their bargaining power. Yet, Novo Nordisk's strong market position and brand reputation help balance this. In 2024, Novo Nordisk's revenue reached DKK 232.6 billion, showing their significant influence.

Global Supply Chain
Novo Nordisk's global supply chain and supplier relationships limit supplier power. Their robust supply chain ensures consistent material flow, reducing disruption risks. Global sourcing provides access to more suppliers, fostering better negotiation. In 2024, Novo Nordisk's revenue reached DKK 338.7 billion, showing supply chain strength.
Strategic Partnerships
Novo Nordisk strategically forms partnerships to mitigate supplier power. These collaborations secure long-term contracts and foster innovation, shielding against price fluctuations. Such alliances ensure stable, high-quality material supplies, driving efficiency and cost reductions. These partnerships are vital for maintaining competitive advantages. In 2024, Novo Nordisk's strategic sourcing initiatives saved the company approximately $500 million.
- Long-term contracts reduce supply risks.
- Collaborative innovation boosts efficiency.
- Partnerships ensure high-quality materials.
- Cost savings drive profitability.
Internal Production
Novo Nordisk's internal production of key ingredients, like active pharmaceutical ingredients (APIs), gives it an advantage. This setup allows for better quality control and can lower costs. It also boosts supply chain security, which is crucial in the pharmaceutical industry. This control is reflected in their financial performance, with a gross margin of 85.7% in 2023.
- Internal production reduces reliance on external suppliers, enhancing control.
- This vertical integration improves supply chain security.
- Novo Nordisk's gross margin reached 85.7% in 2023.
- This strategy strengthens their market position.
Supplier Power: Strategies and Results
Novo Nordisk's diverse supplier base and global sourcing strategies help limit supplier bargaining power. Partnerships and internal production of key ingredients strengthen this position, ensuring supply chain stability. Their robust strategies are reflected in the company's performance. In 2024, they likely continued to focus on these strategies.
| Factor | Impact on Supplier Power | 2024 Data |
|---|---|---|
| Supplier Diversity | Reduces Supplier Power | Maintained a diverse supplier base. |
| Strategic Partnerships | Mitigates Price Fluctuations | $500M savings from sourcing. |
| Internal Production | Enhances Control | Gross margin of 85.7% in 2023. |
Customers Bargaining Power
Healthcare Payer Influence
Healthcare payers, like government programs and insurance companies, have substantial bargaining power due to their size and focus on cost control. They negotiate prices, directly affecting Novo Nordisk's revenue streams. In 2024, rebates and discounts in the US market, influenced by payer negotiations, accounted for a significant portion of the net sales. These negotiations are also shaped by government policies.
Patient Affordability Concerns
Patients' sensitivity to drug prices is rising, especially with high out-of-pocket costs. This can push them toward cheaper options, pressuring Novo Nordisk. Patient groups also influence pricing. In 2024, patient affordability significantly impacted medication choices. Novo Nordisk's revenue growth slowed due to these pressures.

Brand Loyalty and Differentiation
Novo Nordisk's brand strength lessens buyer power. Their diabetes care and other therapies are well-differentiated. In 2024, Novo Nordisk's market cap exceeded $600 billion. Patient loyalty is boosted by marketing and support. This allows them to charge higher prices.
Government Healthcare Policies
Government healthcare policies are crucial for Novo Nordisk, impacting prices and market access. Policies like price controls and reimbursement restrictions directly affect demand for their products. Novo Nordisk must navigate complex regulations and maintain strong relationships with government entities. These policies can significantly influence the company's financial performance. For example, in 2024, price regulations in Europe and the U.S. continued to shape Novo Nordisk's revenue streams.
- Price Controls: Policies that limit the price of drugs, affecting Novo Nordisk's revenue.
- Reimbursement Restrictions: Rules about which drugs are covered by insurance, influencing market access.
- Formulary Decisions: Decisions by insurance companies about which drugs are included in their plans, affecting sales.
Market Access
Gaining and sustaining market access is vital for Novo Nordisk. They must prove their products' value and effectiveness to healthcare providers and payers. Robust clinical data, health economics, and patient outcomes are key for favorable reimbursement. Effective communication of product value boosts Novo Nordisk's negotiation power with buyers.
- In 2024, Novo Nordisk invested heavily in clinical trials to support market access, with R&D expenses reaching $5.2 billion.
- Securing reimbursement is key, with the U.S. and Europe being major markets. In 2024, over 90% of prescriptions for Novo Nordisk's key products were reimbursed.
- Patient-reported outcomes are increasingly important. Novo Nordisk's focus on these has grown, with dedicated teams focused on generating and communicating this data.
Pricing Pressures: How Revenue is Shaped
Healthcare payers like insurance companies have significant bargaining power, directly influencing Novo Nordisk's revenues through price negotiations, impacting their revenue. Patients' sensitivity to drug prices, especially regarding high out-of-pocket costs, pressures Novo Nordisk to offer cheaper options. Brand strength provides leverage, allowing them to charge higher prices.
| Factor | Impact | 2024 Data |
|---|---|---|
| Payer Bargaining | Price negotiations; rebate impact | US rebates/discounts significantly impacted net sales. |
| Patient Sensitivity | Demand for cheaper options | Affordability influenced medication choices; slower revenue growth. |
| Brand Strength | Ability to set prices | Market cap exceeded $600B; marketing boosts loyalty. |
Rivalry Among Competitors
Intense Competition
Novo Nordisk faces fierce competition in the pharmaceutical market, especially in diabetes care. Key rivals include Sanofi, Eli Lilly, and Pfizer, alongside biotech and generic drug makers. In 2024, Novo Nordisk's sales grew, yet competition pressured pricing. The presence of many strong competitors heightens rivalry, influencing market share dynamics.
Pricing Pressures
Pricing pressures significantly affect Novo Nordisk's competitive environment. Healthcare payers and government agencies globally enforce cost-containment strategies. This increases the need for Novo Nordisk to justify its high prices. For example, in 2024, the company faced pricing challenges in the US market. Competition can result in price wars, squeezing profit margins, as seen in the diabetes drug market.

Innovation and R&D
Continuous innovation and R&D are vital for Novo Nordisk's competitive advantage. The company invested DKK 26.5 billion in R&D in 2023, demonstrating its commitment. A strong pipeline of new products is key for sustained growth. This investment helps Novo Nordisk stay ahead of rivals in the pharmaceutical industry.
Market Share
Novo Nordisk actively pursues market share growth, especially in diabetes and obesity treatments. The company competes fiercely, employing strategies like new product introductions and marketing. In 2024, Novo Nordisk's diabetes segment accounted for approximately 80% of its sales. Strategic alliances and promotional efforts are vital for success.
- Diabetes segment sales: ~80% of total sales (2024)
- Competition: Highly intense in diabetes and obesity markets.
- Strategic Actions: Product launches, marketing, partnerships.
- Goal: Maintain and grow market share.
Brand Reputation
Novo Nordisk's brand reputation is a key competitive factor, influencing market share and pricing power. A strong reputation helps attract and retain patients, doctors, and partners. Maintaining this brand requires consistent investment in research, quality, and ethical practices. Positive perception translates into higher sales and customer loyalty; for example, in 2024, Novo Nordisk's market cap reached over $600 billion, reflecting investor confidence.
- Brand strength is crucial in pharmaceuticals, impacting sales.
- Novo Nordisk's reputation supports its market leadership.
- Ongoing investment in brand building is essential.
- Positive brand image enhances customer loyalty and sales.
Market Battle: Diabetes and Obesity
Competition is intense, especially in diabetes and obesity markets. Novo Nordisk's aggressive strategies, including product launches and marketing, aim to maintain market share. In 2024, the diabetes segment dominated sales, about 80%, showcasing the stakes in the rivalry.
| Aspect | Details |
|---|---|
| Key Competitors | Sanofi, Eli Lilly, Pfizer. |
| 2024 Sales Focus | Diabetes segment (~80%) |
| Strategic Actions | Product launches, partnerships. |
SSubstitutes Threaten
Generic Drugs
The rise of generic drugs presents a substantial threat to Novo Nordisk's market position. These cheaper alternatives can quickly capture market share once patents on Novo Nordisk's products expire. For instance, in 2024, the U.S. generic drug market was valued at around $117 billion, showing the scale of this threat. Novo Nordisk, therefore, needs continuous innovation and strong product differentiation to maintain its revenue streams and market leadership.
Alternative Therapies
Alternative therapies and lifestyle changes pose a threat to Novo Nordisk. Dietary changes and exercise are alternatives for diabetes and obesity treatments. These alternatives appeal to some patients. Novo Nordisk must highlight its products' superior benefits. In 2024, the global diabetes market was valued at $69.2 billion.

Emerging Technologies
Emerging technologies pose a threat by offering alternatives to traditional treatments. Digital health solutions and telemedicine are gaining traction. These innovations could reduce the need for Novo Nordisk's drugs. For instance, the global digital health market was valued at $175 billion in 2023, and is projected to reach $660 billion by 2029.
Unique Therapeutic Offerings
Novo Nordisk faces limited threat from substitutes due to its focus on diabetes care and chronic conditions. Their products, such as insulin and GLP-1 receptor agonists, have few direct replacements with similar effectiveness. The company’s unique formulations and delivery systems further protect against easy substitution. In 2024, Novo Nordisk's sales in diabetes care reached DKK 215.1 billion, highlighting the demand for its specialized treatments.
- Limited Substitutes: Insulin and GLP-1 receptor agonists have few direct replacements.
- Unique Formulations: Novo Nordisk uses special formulations and delivery systems.
- Sales Data: Diabetes care sales reached DKK 215.1 billion in 2024.
Brand Loyalty and Physician Preference
Novo Nordisk benefits from high brand loyalty and physician preference, reducing the threat of substitutes. Their strong reputation in diabetes care and other therapeutic areas builds trust. Physician recommendations significantly influence treatment choices, favoring established brands. This loyalty helps maintain market share against potential alternatives. In 2024, Novo Nordisk's market capitalization reached over $600 billion.
- Strong brand recognition and trust mitigate switching.
- Established relationships create market entry barriers.
- Physician recommendations are crucial for treatment decisions.
- Novo Nordisk's market cap exceeded $600 billion in 2024.
Market Dynamics and Competitive Threats
Substitute threats vary for Novo Nordisk due to the nature of its treatments and the market dynamics. While some therapies have alternatives like lifestyle changes, the company's specialized drugs have fewer direct replacements. This differentiation and brand loyalty help protect market share. Novo Nordisk's strong market position is evident in its financial performance.
| Factor | Impact | Data (2024) |
|---|---|---|
| Generic Drugs | Moderate | U.S. generic drug market ~$117B |
| Alternative Therapies | Moderate | Global diabetes market ~$69.2B |
| Digital Health | Growing | Digital health market reached $175B in 2023 |
Entrants Threaten
High Capital Requirements
The pharmaceutical industry's high capital requirements pose a significant threat to Novo Nordisk. Substantial investments in R&D, regulatory approvals, and manufacturing are needed. Clinical trials and compliance costs are high. In 2024, R&D spending in the pharmaceutical sector reached approximately $250 billion globally.
Stringent Regulations
The pharmaceutical industry faces stringent regulations, making it tough for new entrants. Regulatory approval for drugs is a long, expensive process, acting as a major barrier. Newcomers need expertise and resources to navigate this complex landscape. Compliance with Good Manufacturing Practices (GMP) is also crucial. In 2024, clinical trial failures cost the industry billions, highlighting regulatory risks.

Established Brands
Novo Nordisk's strong brand recognition, stemming from its established presence and diverse product portfolio, poses a significant hurdle for new entrants. Customer loyalty and trust in the brand are valuable assets. Replicating Novo Nordisk's robust pipeline and market position is challenging. In 2024, Novo Nordisk's market cap was approximately $600 billion, reflecting its strong brand value.
Intellectual Property
Novo Nordisk benefits from strong intellectual property, especially patent protection, which significantly deters new competitors. This advantage is crucial in the pharmaceutical industry, where innovation is key. Patent protection creates substantial barriers to entry, allowing Novo Nordisk to safeguard its market share and investment in research and development. Defending these patents against infringement is an ongoing and vital aspect of maintaining its competitive edge.
- Novo Nordisk's R&D spending in 2023 was approximately DKK 26.6 billion.
- In 2024, Novo Nordisk has a portfolio of over 40 projects in clinical development.
- The company has been granted over 1,000 patents worldwide.
- Patent litigation costs can range from $1 million to $10 million per case.
Economies of Scale
Novo Nordisk's substantial size provides significant economies of scale, which are difficult for new entrants to replicate. This advantage is seen in manufacturing, marketing, and distribution, allowing for lower per-unit costs. For example, the company's vast production capabilities and established supply chains contribute to its cost efficiencies. New competitors face considerable investment hurdles to achieve similar scale and market reach.
- Manufacturing efficiency enables Novo Nordisk to lower production costs.
- Extensive marketing campaigns build brand recognition.
- Established distribution networks ensure product availability.
- Significant upfront investments are required to compete effectively.
Novo Nordisk: Barriers to Entry Examined
The threat of new entrants to Novo Nordisk is moderate due to significant barriers. High capital requirements, including R&D and regulatory approvals, are major hurdles. Strong brand recognition, intellectual property, and economies of scale further protect Novo Nordisk. In 2024, the pharmaceutical industry faced over $250 billion in R&D expenditures.
| Barrier | Impact | Data (2024) |
|---|---|---|
| Capital Requirements | High Investment Needed | R&D Spending: ~$250B globally |
| Regulations | Lengthy Approvals | Clinical Trial Failures Cost Billions |
| Brand/IP | Competitive Advantage | Novo Nordisk's Market Cap: ~$600B |
Porter's Five Forces Analysis Data Sources
Our analysis uses Novo Nordisk's annual reports, market research, and industry publications for data.
