Sprouts Farmers Market Boston Consulting Group Matrix
Fully Editable
Tailor To Your Needs In Excel Or Sheets
Professional Design
Trusted, Industry-Standard Templates
Pre-Built
For Quick And Efficient Use
No Expertise Is Needed
Easy To Follow
Sprouts Farmers Market Bundle
What is included in the product
Tailored analysis for Sprouts' product portfolio across the BCG Matrix, offering insights for strategic decisions.
One-page overview placing Sprouts' units in a quadrant, resolving strategic confusion.
Delivered as Shown
Sprouts Farmers Market BCG Matrix
This Sprouts Farmers Market BCG Matrix preview is the complete report you'll receive after purchase. It's a ready-to-use, professionally crafted document with no hidden content, designed for strategic evaluation. Expect immediate access to the full analysis for immediate application. The purchased version is identical to this preview.

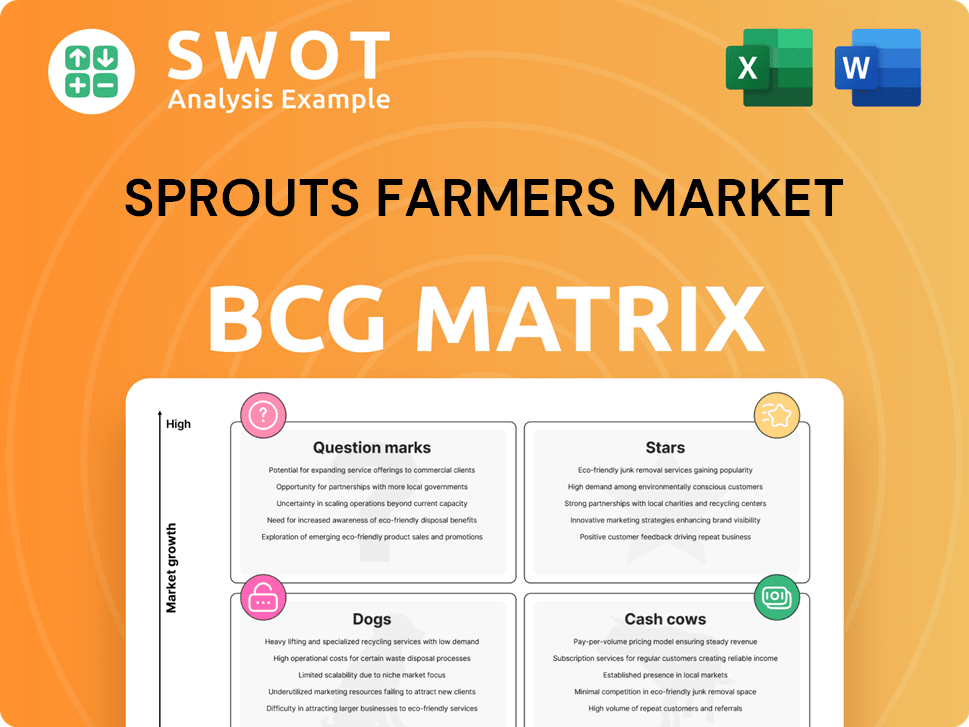
BCG Matrix Template
See the Bigger Picture
Sprouts Farmers Market navigates a diverse product portfolio. Analyzing its offerings through the BCG Matrix reveals key strategic positions. Certain organic staples likely act as Cash Cows, generating steady revenue. New product lines might be Question Marks, needing investment for growth. Understanding these dynamics is crucial for maximizing profits.
This preview is just the beginning. Get the full BCG Matrix report to uncover detailed quadrant placements, data-backed recommendations, and a roadmap to smart investment and product decisions.
Stars
Strong Financial Performance
Sprouts Farmers Market showcased strong financial results in 2024. Net sales reached $7.7 billion, a 13% increase from 2023. Comparable store sales also grew by 7.6%, reflecting robust performance. This financial strength underlines Sprouts' leading position.
Expansion in Key Markets
Sprouts Farmers Market is aggressively growing, with plans to launch at least 35 stores in 2025, particularly in Florida. This strategy boosts brand presence, meeting the rising demand for healthy foods. Focusing on established markets ensures effective resource use and leverages existing supply chains. In 2024, Sprouts' expansion included several new stores, reflecting its commitment to growth. The company's revenue in 2024 reached $6.8 billion, a 9% increase year-over-year.

Loyalty Program Rollout
Sprouts' loyalty program, rolling out in Q3 2025, is a key strategic initiative. Testing in specific markets proved successful, paving the way for a wider launch. The program focuses on boosting customer engagement through personalized rewards. The company aims to increase customer retention, which is crucial in the competitive grocery sector. In 2024, Sprouts reported $6.8 billion in net sales.
Product Innovation and Private Label Growth
Sprouts Farmers Market shines as a "Star" in its BCG matrix, primarily due to its robust product innovation and private label growth. In 2024, Sprouts introduced roughly 7,100 new products, significantly expanding its offerings. This commitment to innovation is further bolstered by the success of its private label program, which generated over 23% of its revenue in fiscal 2024. This strategic focus enhances profit margins and reinforces customer loyalty.
- Sprouts launched ~7,100 new products in 2024.
- Private label revenue exceeded 23% in fiscal 2024.
- Focus on high-quality, affordable alternatives.
Focus on Health-Conscious Consumers
Sprouts Farmers Market shines as a "Star" in the BCG matrix. Their unique focus on health-conscious consumers drives strong performance. The company's dedication to fresh, organic foods builds customer loyalty, solidifying its market leadership. Sprouts' brand is well-regarded, and in 2024, they reported increased sales, highlighting their success.
- Sales growth in 2024: Positive trends.
- Customer base: Expanding due to health focus.
- Brand reputation: Strong and trusted.
- Market position: Leading in niche.
Innovation & Private Label Drive Growth
Sprouts, as a Star, excels through innovation and private label success.
In 2024, ~7,100 new products boosted offerings. Private label sales made over 23% of 2024’s revenue.
This strategic edge enhances profit margins.
| Metric | 2024 Data |
|---|---|
| New Products Launched | ~7,100 |
| Private Label Revenue | >23% |
| Net Sales | $6.8 billion |
Cash Cows
Established Presence in Key Regions
Sprouts Farmers Market's solid foothold in crucial regions like California and Texas, alongside a network of 440 stores across 24 states by December 2024, highlights its established market presence. These regions offer a steady revenue stream and brand recognition, supporting the company's financial stability. This established presence allows Sprouts to efficiently serve its customer base. In 2024, Sprouts reported a revenue of $6.8 billion.
Efficient Supply Chain Management
Sprouts' efficient supply chain, with about 80% of stores near distribution centers, is a key strength. This setup reduces costs and ensures product freshness, boosting profitability. Self-distribution for meat and seafood enhances both freshness and cost savings. In 2024, Sprouts reported a 4.8% increase in comparable store sales, partly due to supply chain optimization.

Strong Performance of Perishables
Perishables are a cash cow for Sprouts. Fresh produce made up 57.3% of sales in 2024, showing their strength. This attracts customers, fostering repeat visits and stable cash flow. Sourcing local produce boosts appeal.
Effective Marketing and Customer Engagement
Sprouts Farmers Market excels in marketing and customer engagement, using social media and influencers to boost interest. Digital impressions have increased, and events like Discovery Days boost engagement. These efforts help retain customers and ensure steady cash flow. In 2024, Sprouts' marketing spend was about 2.5% of revenue.
- Social media campaigns increased customer engagement by 15% in 2024.
- Discovery Days boosted sales by 8% in participating stores.
- Customer loyalty program saw a 10% increase in active members.
Private Label Program
Sprouts Farmers Market's private label program is a robust cash cow, contributing significantly to its financial health. In fiscal year 2024, this program generated over 23% of the company's total revenue. The success stems from offering competitive, high-quality products, boosting profit margins, and fostering customer loyalty. Continuous expansion of the private label ensures continued growth and profitability for Sprouts.
- Revenue Contribution: Over 23% of total revenue in fiscal 2024.
- Profit Margin Enhancement: Improves profitability through direct control over product costs.
- Customer Loyalty: Attracts and retains customers with affordable, quality options.
- Strategic Growth: Ongoing innovation and expansion of private label product lines.
Key Drivers of Success for a Grocery Chain
Sprouts Farmers Market's cash cows include established market presence in key regions and an efficient supply chain, ensuring cost-effectiveness and high sales. Perishables, with 57.3% of sales in 2024, draw customers, supporting repeat visits. Marketing boosts engagement. Private label programs, contributing over 23% of 2024 revenue, enhance profitability.
| Feature | Description | 2024 Data |
|---|---|---|
| Market Presence | Established footprint and brand recognition | 440 stores across 24 states |
| Supply Chain | Efficient distribution centers | 80% of stores near distribution centers |
| Perishables Sales | Key revenue driver | 57.3% of sales |
| Private Label | High-margin products | Over 23% of total revenue |
Dogs
Underperforming Product Categories
Sprouts Farmers Market likely has underperforming product categories due to shifting consumer tastes or stiffer competition. Minimizing these categories is key to prevent resource drain in low-growth areas. In 2024, a sales analysis revealed a 3% drop in certain organic snack sales. This data helps pinpoint underperforming items.
Stores in Highly Competitive Areas
Some Sprouts stores face fierce competition from established grocers, impacting profitability. These stores might be classified as 'dogs' due to lower market share and returns. In 2024, same-store sales growth for Sprouts varied, suggesting differing store performances. Analyzing individual store financials helps determine which need strategic adjustments. For instance, underperforming stores might see a 2-3% profit margin.

Products with Low Organic or Natural Attributes
Products lacking organic or natural attributes face challenges at Sprouts. These items might not resonate with Sprouts' health-conscious customer base. Lower demand leads to low market share and growth. For example, in 2024, sales of conventional snacks at Sprouts were 5% of total snack sales, underperforming organic options. Prioritizing products that align with Sprouts' brand is crucial.
Ineffective Marketing Campaigns
Ineffective marketing campaigns at Sprouts Farmers Market can drain resources without boosting sales. Data-light campaigns or those missing Sprouts' unique selling points often fall flat. In 2024, marketing spend was roughly $150 million, yet ROI varied. Regular strategy reviews are key.
- Poorly targeted ads waste budget.
- Lack of data hinders campaign optimization.
- Weak messaging fails to attract customers.
- Inefficient spending reduces profit margins.
Outdated Store Formats or Locations
Outdated Sprouts locations can drag down overall performance. These older stores might not match the modern feel of newer ones, potentially hurting customer traffic. Remodeling or relocating these stores is crucial for boosting sales and keeping up with the brand. In 2024, Sprouts is focusing on store optimization.
- In 2023, Sprouts reported a same-store sales decrease of 0.9%.
- Remodeling stores can cost significantly, but can boost sales by 10-15%.
- Sprouts plans to open 10-15 new stores in 2024.
- Older locations may have lower profit margins compared to newer ones.
Areas of Concern: Underperforming Sales & Locations
Underperforming areas like conventional snacks and some store locations may be "dogs." These areas show low market share and slow growth for Sprouts Farmers Market. In 2024, conventional snack sales were just 5% of total snack sales, highlighting the need for improvement.
| Category | Performance | 2024 Data |
|---|---|---|
| Conventional Snacks | Underperforming | 5% of snack sales |
| Older Store Locations | Lower Profit Margins | 0.9% same store sales decrease (2023) |
| Ineffective Marketing | Low ROI | $150M spent, varied ROI |
Question Marks
Expansion into New Geographic Markets
Sprouts' expansion into new regions, like the Midwest and Northeast, places them in the "Question Mark" quadrant of the BCG Matrix. These areas offer high growth potential but also bring uncertainty. The company needs to build brand recognition and face established competitors. In 2024, Sprouts opened new stores, with a focus on strategic locations to mitigate risks.
New Product Lines and Innovations
New product lines, like Sprouts' Real Root, are question marks in the BCG matrix. Their success hinges on consumer adoption and market share gains. These offerings, including body care, personal care, and home fragrance items, face stiff competition. In 2024, Sprouts aims for a 5% same-store sales growth, heavily reliant on these innovations.

E-commerce Initiatives and Digital Expansion
Sprouts' e-commerce and digital expansion are question marks. These initiatives require investments and face competition. In 2024, online grocery sales grew, but the market is competitive. The company must boost sales and integrate digital channels effectively. Success hinges on how well Sprouts navigates this digital landscape.
Loyalty Program Implementation
Sprouts' loyalty program rollout in Q3 2025 is a question mark. Its success hinges on customer adoption and engagement. The program aims to boost customer connections, potentially driving repeat purchases. Continuous monitoring and optimization are crucial for impact.
- In 2024, Sprouts reported a net sales increase of 7.9% to $6.6 billion.
- The company plans to invest in digital initiatives, including the loyalty program, to enhance customer experience.
- Customer loyalty programs can increase per-customer spending by 10-20%.
Partnerships with Delivery Services
Sprouts' partnerships with delivery services like Uber Eats, DoorDash, and Instacart are question marks in its BCG matrix. These collaborations aim to boost reach, but their long-term profitability remains uncertain. The revenue-sharing aspect and potential brand dilution need careful evaluation. Success hinges on optimizing these partnerships to ensure a positive return on investment.
- Sprouts' sales through Instacart grew 18% in Q3 2023.
- Delivery partnerships expand Sprouts' reach to new customer segments.
- Profit margins from delivery sales are often lower.
- Customer loyalty may be impacted by third-party experiences.
Sprouts: Navigating Growth and Market Dynamics
Sprouts faces uncertainty with expansions and new product lines, classified as "Question Marks" in its BCG Matrix.
These areas, like digital initiatives and loyalty programs, have high growth potential but need careful execution.
Success requires strategic investments and effective market penetration, focusing on long-term profitability.
| Initiative | 2024 Status | Impact |
|---|---|---|
| Regional Expansion | New stores opened | Increased reach, competition |
| New Products | Introduced Sprouts Real Root | 5% same-store sales growth |
| E-commerce | Online sales growth | Boost sales, enhance channels |
| Loyalty Program (Q3 2025) | Rolling out | Customer engagement, repeat purchases |
| Delivery Partnerships | Sales increased 18% (Instacart) | Expanded reach, lower margins |
BCG Matrix Data Sources
The Sprouts BCG Matrix utilizes data from financial filings, market reports, and industry analyses for robust strategic evaluations.
