STV Group Plc Porter's Five Forces Analysis
Fully Editable
Tailor To Your Needs In Excel Or Sheets
Professional Design
Trusted, Industry-Standard Templates
Pre-Built
For Quick And Efficient Use
No Expertise Is Needed
Easy To Follow
STV Group Plc Bundle
What is included in the product
Identifies disruptive forces, emerging threats, and substitutes that challenge market share.
Swap in your own data to accurately reflect the forces shaping STV Group Plc's market.
Same Document Delivered
STV Group Plc Porter's Five Forces Analysis
This preview showcases STV Group Plc's Porter's Five Forces analysis in its entirety.
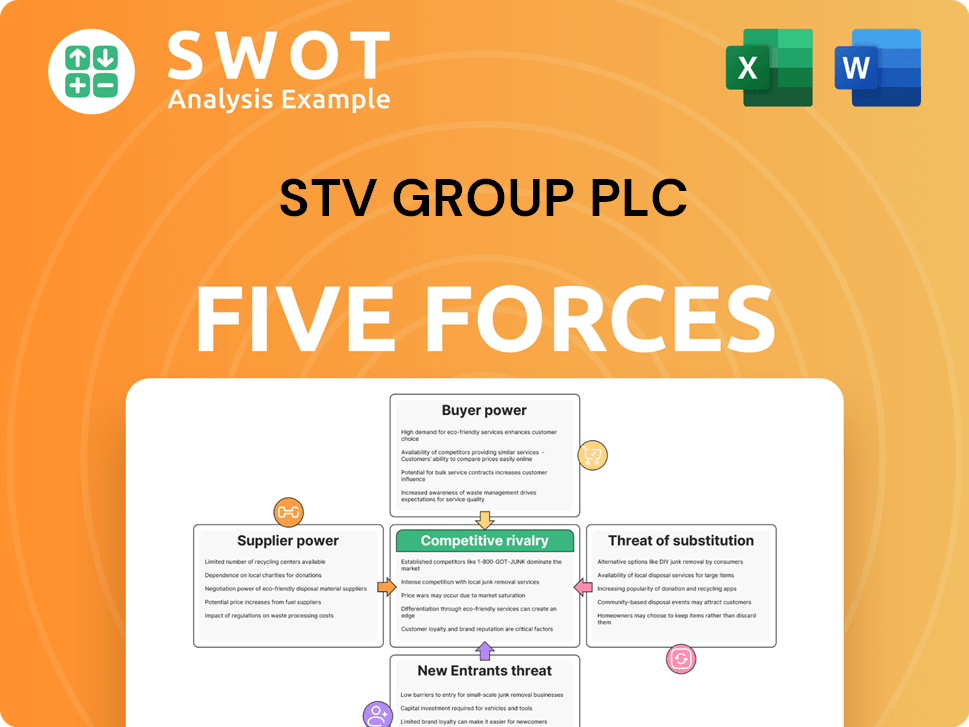
The document details competitive rivalry, supplier power, buyer power, threat of substitutes, and new entrants.
You're viewing the complete, ready-to-use analysis file.
No alterations are needed; what you see is what you'll download immediately after purchase.
This professionally formatted document is immediately accessible.

Porter's Five Forces Analysis Template
From Overview to Strategy Blueprint
STV Group Plc operates in a competitive media landscape. Buyer power is moderate, influenced by audience choice. Supplier power, particularly from content creators, is also a key factor. The threat of new entrants is relatively low, due to high barriers. Substitute products, such as streaming services, pose a growing challenge. Competitive rivalry is intense, with numerous established players.
Ready to move beyond the basics? Get a full strategic breakdown of STV Group Plc’s market position, competitive intensity, and external threats—all in one powerful analysis.
Suppliers Bargaining Power
Content Creators
Content creators, including production companies and freelance talent, wield some influence, especially for unique content. STV's dependence on specific creators grants them leverage, particularly with alternative distribution options. In 2024, the global video content market was valued at approximately $400 billion. AI's rise in creative industries could reshape content creation dynamics long-term.
Technology Providers
Technology providers, offering broadcasting and streaming solutions, wield moderate power over STV. STV depends on these suppliers for vital functions, yet a diverse vendor landscape reduces single-supplier dominance. The market's digital shift further amplifies reliance on tech providers. In 2024, STV's technology spending increased by approximately 8%, reflecting this dependency.

Licensing and Rights Holders
STV Group's reliance on licensing for sports and film content gives suppliers like rights holders substantial power. High-demand content allows them to set prices and terms, impacting STV's profitability. The Reliance-Disney deal in India, reportedly valued at $8.5 billion in 2024, underscores the significant costs of securing key content. This bargaining power affects STV's ability to negotiate favorable deals.
Transmission Network Operators
Transmission network operators exert moderate bargaining power over STV Group Plc. These operators are essential for content delivery, yet STV can utilize alternative methods. The market dynamics are influenced by the availability of options and technological advancements. The 2024 data suggests that the market share of traditional broadcasting is decreasing.
- STV relies on transmission networks for content delivery, but alternatives exist.
- Satellite and cable offer alternative content distribution options.
- 5G technology could alter the dependence on current operators.
- The shift towards digital platforms impacts traditional broadcasters.
Advertising Agencies
STV Group's reliance on advertising revenue means understanding the power of advertising agencies is key. The bargaining power of these agencies is generally low for STV. STV can choose from numerous agencies or deal directly with advertisers, maintaining its position. However, shifts in advertising, like the growth of digital and retail media, could change this balance.
- STV's advertising revenue reached £124.4 million in 2023.
- Digital advertising revenue increased by 10% in 2023.
- STV has a market capitalization of approximately £130 million as of May 2024.
STV's Supplier Power Dynamics Explored
STV Group faces varied supplier bargaining power across different content segments.
Rights holders for sports and film content have substantial influence due to high-demand content and licensing costs.
Content creators and technology providers hold moderate power, while advertising agencies have less leverage.
| Supplier Type | Bargaining Power | Impact on STV |
|---|---|---|
| Content Rights Holders | High | Affects profitability and deal terms. |
| Content Creators/Tech Providers | Moderate | Influence on content and operations. |
| Advertising Agencies | Low | STV's negotiating strength. |
Customers Bargaining Power
Viewers
Viewers wield significant bargaining power given abundant entertainment choices. They can effortlessly move between channels, streaming services, and diverse media platforms. In 2024, the average UK viewer spent over 4 hours daily watching video content. STV must provide captivating content and an excellent user experience to retain viewers on platforms such as STV Player. STV's 2023 annual report showed a 3% increase in streaming viewing hours.
Advertisers
Advertisers significantly impact STV Group's revenue, controlling ad spending across broadcast and digital platforms. Their choices directly affect STV's financial health; in 2024, advertising revenue was a major income source. As digital advertising grows, STV must understand and meet advertisers' evolving needs to stay competitive. STV's success hinges on attracting and retaining advertisers.

Affiliates and Distribution Partners
STV Group's relationships with affiliates and distribution partners, such as streaming platforms, significantly influence customer reach. These partners can negotiate revenue-sharing terms, affecting STV's financial outcomes. For example, in 2024, content distribution deals shaped about 20% of STV's total revenue. Bundling partnerships also impact content distribution and consumption patterns.
Subscription Service Customers
For STV Player and potential subscriptions, customers hold sway. They can easily cancel if content or value disappoints. Subscription models and demand for ad-free content amplify this power. In 2024, streaming subscribers are highly sensitive to price and content quality. STV must deliver or risk churn.
- Subscriber churn rates are a critical metric, reflecting customer dissatisfaction.
- The availability of alternative streaming services increases customer power.
- Competitive pricing is essential to attract and retain subscribers.
- Content exclusivity significantly impacts customer loyalty.
Content Bundling
Content bundling, where various media are packaged together, affects customer power. Companies like Sky and Virgin Media, offering bundled services, gain leverage. STV must make its content appealing within these bundles to secure viewership. Early partnership experiments hint at industry consolidation.
- In 2024, bundled TV and internet packages accounted for over 60% of UK household media consumption.
- STV's revenue from content licensing and distribution increased by 15% in the last year, reflecting the importance of these deals.
- Industry analysts predict a further 10% consolidation in the UK media market by the end of 2024.
STV's Customer Power: Choice & Pricing
Customers possess strong bargaining power over STV. Viewer choice among diverse entertainment options remains key. Streaming services and pricing significantly influence consumer decisions. The STV Player's appeal must meet customer demands.
| Aspect | Impact | Data (2024) |
|---|---|---|
| Viewer Choice | High | Avg. UK viewer watches 4+ hrs/day of video. |
| Subscription | Sensitive | Churn rates affect revenue and content preferences. |
| Bundling | Influential | 60%+ UK homes use bundled media packages. |
Rivalry Among Competitors
Other Broadcasters
STV competes fiercely with BBC Scotland and ITV for viewers and ad revenue. In 2024, BBC Scotland's budget was approximately £100 million, while ITV's advertising revenue remained a significant source of income, pressuring STV. This rivalry affects audience share and programming costs.
Streaming Services
The rise of streaming services, like Netflix, Amazon Prime Video, and Disney+, heightens competition. These platforms offer extensive on-demand content, drawing viewers from traditional TV. The global video streaming market, valued at $170.27 billion in 2023, is expected to reach $367.07 billion by 2030. This growth intensifies pressure on STV Group.

Content Production Companies
STV Studios faces intense competition from content production companies vying for commissions. Success hinges on producing high-quality, appealing content. In 2024, STV Studios secured significant commissions, including the renewal of "Antiques Road Trip," demonstrating a robust competitive position. The UK's TV production sector saw a 15% increase in production spend in 2023, highlighting the competition. STV Studios' revenue in 2023 was £168.1 million.
Digital Media Platforms
Competition for STV Group Plc intensifies with digital media platforms, including YouTube, TikTok, and social media channels, vying for viewers and advertising revenue. These platforms are fragmenting the media landscape, with significant impacts. For example, in 2024, YouTube's advertising revenue reached billions. AI-driven disruption and diversification further change search and content discovery.
- YouTube's advertising revenue in 2024 reached billions.
- TikTok's user base continues to grow, attracting advertisers.
- Social media channels offer alternative content consumption.
- AI is changing content discovery and user engagement.
Mergers and Acquisitions
Mergers and acquisitions (M&A) significantly intensify competitive rivalry in the media sector. These deals lead to larger entities with amplified resources and market dominance. For example, in 2024, the media and entertainment industry saw a surge in M&A activity, with deals reaching over $100 billion globally. This consolidation increases pressure on smaller players.
- The value of M&A deals in the media and entertainment industry reached over $100 billion globally in 2024.
- Consolidation creates more powerful competitors.
- Reliance Industries and The Walt Disney Company collaboration is an example.
STV's Rivals: A Fierce Media Battleground
STV faces intense competition from traditional broadcasters like BBC Scotland and ITV. Streaming services and digital platforms further fragment the media landscape. M&A activity intensifies rivalry, creating larger, more dominant competitors.
| Factor | Impact | 2024 Data |
|---|---|---|
| Traditional TV | Audience share and revenue pressure | ITV advertising revenue significant. BBC Scotland budget approx. £100M |
| Streaming Services | Increased competition for viewers | Global streaming market value $170.27B (2023), growing to $367.07B by 2030. |
| Digital Media | Revenue and audience competition | YouTube advertising revenue in the billions |
| M&A | Consolidation and market dominance | Media M&A deals over $100B globally in 2024. |
SSubstitutes Threaten
Streaming Services
Streaming services pose a significant threat to STV Group Plc. Platforms like Netflix and Disney+ offer on-demand content, competing directly with traditional TV. The global streaming market is booming; in 2024, it's projected to reach over $80 billion. This growth indicates a shift in consumer preference, intensifying the threat.
Video-on-Demand Platforms
Video-on-demand platforms like YouTube and Vimeo pose a threat to STV Group. These platforms offer viewers alternatives to scheduled TV, potentially diverting audiences. User-generated content and niche channels compete for viewers' attention. The live video streaming segment significantly impacts revenue streams. In 2024, the global video streaming market is valued at over $100 billion.

Social Media
Social media platforms, including Facebook, Instagram, and TikTok, provide short-form videos and live streams, vying for viewer attention. These platforms are prevalent among younger demographics, posing a threat to traditional TV broadcasters. In 2024, TikTok's daily active users are over 150 million in the US. The rise of smartphones fuels digital content consumption via social media.
Gaming and Interactive Entertainment
Gaming and interactive entertainment pose a substantial threat to STV Group Plc. Video games and esports compete for audience attention and advertising revenue. The rise of AI further intensifies this competition, potentially offering more engaging and personalized entertainment experiences. For example, the global video game market was valued at $282.6 billion in 2023.
- Video games as alternative entertainment.
- Esports' growing popularity.
- AI's impact on gaming experiences.
- Competition for advertising revenue.
Other Leisure Activities
Traditional leisure activities like reading, sports, and hobbies present a threat to STV Group Plc. Consumers spread their time and money across various entertainment options, impacting TV viewership. The rise of IoT and urbanization, demanding high-quality content, also influences viewing habits. These factors create competition for STV's broadcasting services.
- In 2024, the average time spent on traditional media decreased.
- Digital media consumption increased by 15% in urban areas.
- Subscription video-on-demand (SVOD) services grew by 10% in 2024.
Entertainment Rivals Challenge STV Group
STV Group faces threats from entertainment substitutes. These range from streaming services to social media and gaming. These alternatives compete for audience attention and advertising revenue. Each of these substitutes has a significantly growing user base.
| Substitute Type | Examples | 2024 Market Data |
|---|---|---|
| Streaming Services | Netflix, Disney+ | Projected to exceed $80B |
| Video-on-Demand | YouTube, Vimeo | Valued over $100B |
| Social Media | TikTok, Instagram | TikTok US daily active users: 150M+ |
| Gaming | Video games, Esports | Global market valued at $282.6B (2023) |
Entrants Threaten
Online Streaming Platforms
The threat of new entrants for STV Group Plc's online streaming is considerable. New streaming services can launch easily, using cloud infrastructure and content. Consumer preference for online streaming is increasing, boosting this threat. The global live streaming market, valued at $84.3 billion in 2023, offers growth.
Content Aggregators
Content aggregators, compiling diverse content onto a single platform, present a threat. These aggregators streamline content access, offering a convenient alternative to individual subscriptions. Experimental partnerships among DTC platforms hint at industry consolidation; for instance, in 2024, streaming services explored bundling options to retain subscribers. This trend intensifies competition.

Digital Media Companies
Digital media companies pose a threat to STV Group. They can leverage existing online audiences to enter the video content market, competing with traditional broadcasters. These firms benefit from strong brand recognition and loyal followings, providing a competitive edge. In 2024, digital ad revenue is projected to reach $340 billion, highlighting the scale of competition. The rise of streaming services further intensifies this threat, with platforms like Netflix and Amazon Prime investing heavily in original content.
Technology Giants
Large tech firms pose a significant threat. Companies like Apple and Google could easily enter the media space. Their vast resources and user bases give them a strong edge. AI's impact is another factor, with search technologies evolving quickly.
- Apple's revenue in 2024 was approximately $383 billion.
- Google's parent company, Alphabet, had $307.39 billion in revenue in 2023.
- Amazon's net sales in 2023 totaled $574.7 billion.
Niche Content Providers
Niche content providers pose a threat by attracting specific audiences away from general broadcasters like STV Group Plc. These providers specialize in particular interests, offering unique content not found elsewhere. The rise of short-form video platforms is significant, with TikTok's revenue reaching approximately $16.6 billion in 2023. Media companies are focusing on personalized content for deeper audience resonance.
- Specialized content attracts dedicated viewers.
- Niche providers often focus on underserved markets.
- Short-form video platforms are gaining traction.
- Personalized content strategies are emerging.
Streaming Service Showdown: New Rivals Emerge
The threat of new entrants to STV Group's streaming service is high due to low barriers to entry and increasing consumer demand. Aggregators and digital media firms, with strong online presence and brand recognition, compete fiercely. Big tech firms like Apple, with a 2024 revenue of around $383 billion, also present a significant competitive challenge.
| Factor | Impact | Examples |
|---|---|---|
| Low Barriers | Easy to enter the market | Cloud infrastructure, readily available content |
| Aggregators | Convenient access to content | Bundling, partnerships |
| Tech Giants | Vast resources | Apple ($383B revenue), Google |
Porter's Five Forces Analysis Data Sources
The analysis utilizes annual reports, financial news, and market research to assess competitive forces. Additional data is sourced from regulatory filings and industry publications.
