Foschini Group Marketing Mix
Fully Editable
Tailor To Your Needs In Excel Or Sheets
Professional Design
Trusted, Industry-Standard Templates
Pre-Built
For Quick And Efficient Use
No Expertise Is Needed
Easy To Follow
Foschini Group Bundle
What is included in the product
A deep dive into Foschini's Product, Price, Place, and Promotion strategies, grounded in real-world brand practices.
Provides a concise snapshot of TFG's marketing approach, offering quick access to essential strategic elements.
What You See Is What You Get
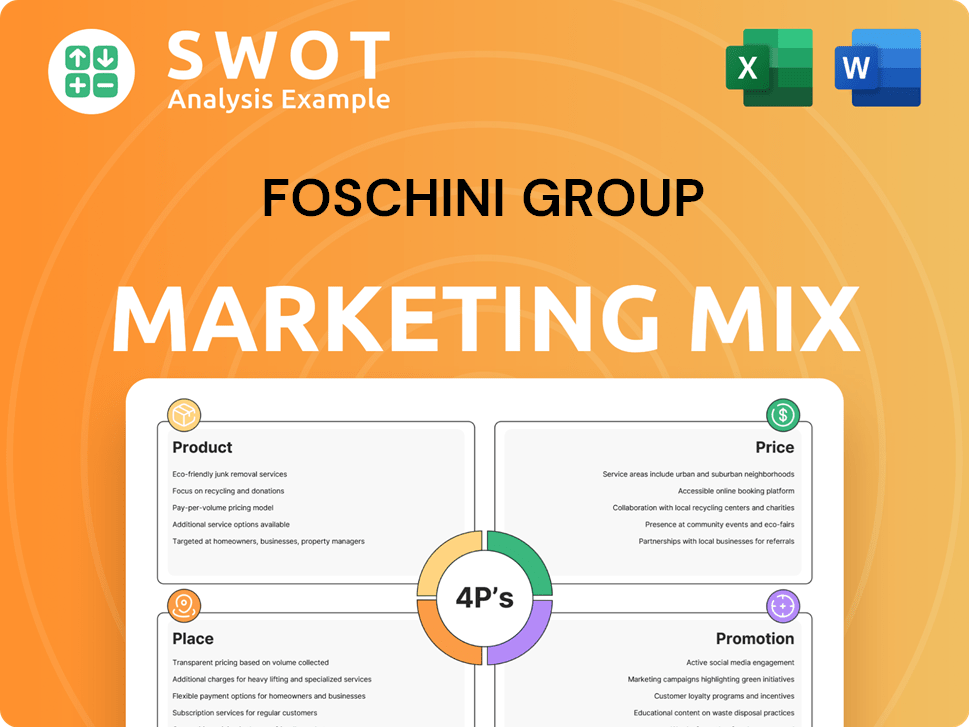
Foschini Group 4P's Marketing Mix Analysis
The analysis you are viewing provides an overview of Foschini Group's marketing mix. This comprehensive examination details its Product, Price, Place, and Promotion strategies.
This document thoroughly analyzes each element within the 4Ps framework, providing a clear and concise understanding. The preview shown here is the actual document you’ll receive instantly after purchase—no surprises.

4P's Marketing Mix Analysis Template
Ready-Made Marketing Analysis, Ready to Use
Discover how the Foschini Group strategically blends product, price, place, and promotion to dominate the market. Their diverse product range caters to varied customer needs, a key strength. Analyzing their pricing strategies reveals clever tactics for profit maximization. Distribution channels, both online and in-store, are a pivotal success factor. Explore their effective promotional campaigns and integrated marketing.
Want deeper insights? This in-depth 4Ps Marketing Mix Analysis breaks down Foschini Group's tactics with precision and is fully editable!
Product
Diverse Brand Portfolio
TFG's diverse brand portfolio spans fashion, jewelry, and homeware, targeting varied customer segments. This extensive range, featuring brands like Foschini and Markham, boosts market reach. In FY24, TFG reported a 16.8% increase in retail turnover. This strategy allows for a competitive edge, providing a wide selection for consumers.
Fashion, Lifestyle, and Homeware s
TFG's product strategy centers on fashion, lifestyle, and homeware, offering clothing, footwear, and home goods. This broad selection aims to capture diverse consumer demands. In 2024, TFG's fashion sales reached approximately R20 billion, reflecting its strong market presence. The homeware segment also saw growth, with sales increasing by 10% year-over-year.

Credit and Insurance Services
TFG's financial arm offers store credit cards, personal loans, and insurance, enhancing customer value. These services are crucial for revenue. In FY2024, credit and insurance contributed substantially. The segment generated a 23.9% increase in profit before tax.
Focus on Quality and Fashionability
The Foschini Group (TFG) prioritizes offering quality, fashionable products to stay competitive. They regularly refresh their product lines and adjust brand positioning to appeal to their customer base. This strategy is crucial for maintaining market relevance and driving sales. In fiscal year 2024, TFG reported a 17.1% increase in retail turnover. This shows the effectiveness of their product strategy.
- Product innovation is key for TFG.
- The company invests in trend forecasting.
- TFG's brands are constantly evolving.
- Quality control is a top priority.
Own-Label and International Brands
TFG's product strategy includes a diverse portfolio of owned-label and international brands. This approach allows them to target different customer segments effectively. In 2024, own-label brands like Redbat contributed significantly to sales. International brands, especially in cosmetics and sportswear, broaden their market reach. This mix enhances TFG's market position and revenue streams.
- Own-label brands offer higher profit margins.
- International brands increase brand recognition.
- The strategy supports diverse consumer preferences.
- It enhances market resilience.
TFG's 2024 Strategy: Fashion, Lifestyle, and Homeware Domination!
TFG's product strategy involves a diverse portfolio of fashion, lifestyle, and homeware brands. This mix caters to varied customer needs. Own-label and international brands boost market reach, with fashion sales at about R20B in 2024.
| Aspect | Details | 2024 Data |
|---|---|---|
| Product Categories | Fashion, Lifestyle, Homeware | Significant sales in all categories |
| Brand Strategy | Own-label and International | Redbat, cosmetics brands expanded |
| Financial Impact | Retail turnover increased | 16.8% |
Place
Extensive Store Network
TFG boasts an extensive physical store network. As of 2024, TFG had over 3,000 stores. This expansive presence ensures accessibility for customers. The wide footprint supports strong brand visibility and market penetration. This is crucial for capturing diverse consumer segments.
Omnichannel Retail Strategy
The Foschini Group (TFG) is actively implementing an omnichannel retail strategy. This involves blending physical stores with digital platforms for unified shopping. In 2024, TFG's digital sales grew, showing success in its omnichannel approach. This strategy aims for seamless online and in-store customer experiences. TFG's focus is on providing integrated shopping journeys.

Online Platforms
TFG leverages online platforms like Bash for its digital strategy. Bash integrates various TFG brands, enhancing customer convenience. Online sales grew significantly, with digital sales contributing 30.5% to TFG's total retail turnover in 2024. This expansion taps into the increasing online retail market.
Distribution Centres
Foschini Group's distribution centres are vital for supply chain efficiency. They manage inventory and ensure product availability across stores and online. These centres streamline logistics, supporting timely delivery to customers. The company's investment in these centres reflects its commitment to operational excellence. In 2024, TFG's logistics spend was significant, underlining the importance of these centres.
- Supply chain optimization is a core focus.
- Distribution centres facilitate quick product turnover.
- Investment in logistics is key for TFG's strategy.
- Efficient distribution supports customer satisfaction.
International Presence
TFG's international presence is a key element of its marketing strategy, particularly in the UK and Australia. This expansion, achieved through acquisitions and partnerships, broadens their market reach. As of the latest reports, international operations contribute significantly to TFG's revenue, showcasing the success of this strategy. In 2024, international sales accounted for a substantial portion of total group sales, demonstrating the impact of their global footprint.
- TFG's international segment reported a 20% increase in revenue in the last financial year.
- The UK and Australian markets have become key growth drivers.
- Strategic acquisitions have been instrumental in market penetration.
TFG's 2024: Omnichannel & Global Growth
TFG strategically utilizes its physical store network, which, as of 2024, exceeded 3,000 stores, alongside a robust omnichannel approach. Digital sales contributed 30.5% to TFG's total retail turnover in 2024, reflecting the integration of online and in-store experiences, boosted by platforms like Bash. International operations, including the UK and Australia, significantly enhanced revenue, with international sales comprising a notable portion of overall group sales, highlighted by a 20% revenue increase in the last financial year.
| Place Element | Description | 2024 Data |
|---|---|---|
| Store Network | Physical store presence, ensuring accessibility and brand visibility. | Over 3,000 stores |
| Omnichannel Integration | Blending physical and digital platforms for unified shopping. | Digital sales: 30.5% of total retail turnover |
| International Expansion | Strategic presence, especially in the UK and Australia. | International sales contributed significantly; 20% revenue increase |
Promotion
Multi-brand Marketing
TFG utilizes multi-brand marketing, tailoring strategies for each brand within its portfolio. This approach allows for targeted communication. In 2024, TFG's marketing spend was approximately R3.5 billion. This strategy boosts brand recognition. It aims to resonate with different customer segments. This is a part of its 4P's Marketing Mix Analysis.
Digital Marketing and Social Media
TFG leverages digital marketing and social media for customer engagement and sales. They create visually appealing content and interactive campaigns. In 2024, digital marketing spend increased by 15%, showing its importance. Social media campaigns boosted online sales by 20%.

Customer Loyalty Programs
The Foschini Group (TFG) utilizes customer loyalty programs, primarily TFG Rewards, to foster enduring customer relationships. This program offers benefits such as discounts and tailored promotions to encourage repeat purchases. In 2024, TFG reported that their loyalty programs significantly contributed to sales growth, with members showing higher spending. Customer retention is a core focus, with loyalty programs playing a crucial role in this strategy.
In-Store s and Experiences
Foschini Group leverages its physical stores for promotions, creating immersive shopping environments. They use merchandising to boost sales and provide personalized customer service. This strategy aims to boost customer engagement and loyalty. In 2024, TFG reported a 16.2% increase in retail turnover.
- In-store events and displays attract customers.
- Personalized service enhances the shopping journey.
- These efforts boost brand perception and sales.
Collaborations and Partnerships
TFG leverages collaborations to boost its marketing efforts. These partnerships involve influencers, celebrities, and global suppliers. Such alliances enhance brand visibility and facilitate new product introductions. For instance, TFG's partnership with international brands has helped expand its market reach. This strategy is reflected in the company's reported marketing spend of R3.2 billion for the 2024 financial year.
- Increased Brand Visibility
- New Product Launches
- Expanded Market Reach
- Marketing Spend: R3.2B (2024)
TFG's Marketing Blitz: R3.2B Investment Drives Growth!
TFG's promotions include multi-brand marketing, digital campaigns, and loyalty programs like TFG Rewards, boosting brand visibility and sales. In 2024, they spent R3.2B on marketing, showing commitment to promotions. This strategy encompasses in-store events, leveraging influencer collaborations for reach.
| Promotion Strategy | Description | 2024 Impact |
|---|---|---|
| Multi-Brand Marketing | Tailored strategies for each brand. | Increased brand recognition. |
| Digital Marketing | Social media and interactive campaigns. | Digital marketing spend increased by 15%. |
| Loyalty Programs | TFG Rewards: Discounts and tailored offers. | Loyalty programs boosted sales growth. |
Price
Affordable to Upper Market Pricing
TFG's pricing strategy spans affordable to premium, reflecting its diverse brand portfolio. They target varied income levels. This approach is evident in their financial reports; in FY2024, TFG's revenue was approximately R47.1 billion, showcasing broad customer reach. By 2025, analysts predict further market penetration.
Credit Facilities
Offering credit facilities, like store cards and personal loans, is a key part of TFG's pricing. This approach boosts accessibility and drives revenue via interest and fees. In FY2024, TFG's credit book reached R8.5 billion. This strategy significantly impacts sales, particularly in the current economic climate.

Competitive Pricing
TFG faces stiff competition, requiring a keen eye on competitor pricing. They aim for prices that are attractive yet reflect product value. In 2024, TFG's focus was on value-driven pricing. This strategy helped maintain margins amidst economic pressures.
Pricing Policies and Discounts
The Foschini Group (TFG) strategically employs pricing policies, including discounts and promotions, to boost sales and manage stock. They closely monitor markdown ratios to enhance both sales and profitability. In the six months ended September 2024, TFG's retail turnover increased by 10.6% to R22.9 billion. Gross profit margin was 46.9%.
- Promotional activities drive customer engagement.
- Markdown ratios are a key performance indicator.
- TFG uses data analytics for pricing decisions.
- Pricing strategies adapt to market trends.
Value-Added Services
The Foschini Group's pricing strategy extends beyond product costs, encompassing value-added services that enhance the customer experience. These services, such as insurance products and flexible payment options, boost the perceived value. In fiscal year 2024, TFG reported a 15.9% increase in online retail sales, indicating the importance of convenient shopping experiences. These services allow TFG to capture more revenue per customer. This strategy supports TFG's goal of driving customer loyalty and maximizing profitability.
- Insurance products and flexible payment options enhance customer value.
- Online retail sales grew by 15.9% in 2024.
- Value-added services increase revenue per customer.
- This strategy drives customer loyalty.
TFG's Strategy: Affordable Luxury & Sales Surge!
TFG's pricing is a blend of affordability and premium offerings, matching various income levels. Credit facilities and promotional activities fuel accessibility and sales growth, evidenced by a 10.6% retail turnover increase in the six months ended September 2024. Data-driven decisions and value-added services like insurance and flexible payments also elevate the customer experience.
| Aspect | Details | Impact |
|---|---|---|
| Pricing Strategy | Diverse, catering to varied income groups | Broad market reach; FY2024 revenue ~R47.1B |
| Credit Facilities | Store cards & loans | Boost sales; R8.5B credit book in FY2024 |
| Promotions | Discounts, value-added services, convenient shopping experiences | Increased retail turnover by 10.6% in 6M ended Sep'24; 15.9% online retail sales growth in FY24 |
4P's Marketing Mix Analysis Data Sources
Our 4P analysis relies on financial filings, investor presentations, and brand websites. We also analyze store locations, campaign data, and competitor info.
