Walt Disney Porter's Five Forces Analysis
Fully Editable
Tailor To Your Needs In Excel Or Sheets
Professional Design
Trusted, Industry-Standard Templates
Pre-Built
For Quick And Efficient Use
No Expertise Is Needed
Easy To Follow
Walt Disney Bundle
What is included in the product
Tailored exclusively for Walt Disney, analyzing its position within its competitive landscape.
Customize pressure levels based on new data or evolving market trends.
What You See Is What You Get
Walt Disney Porter's Five Forces Analysis
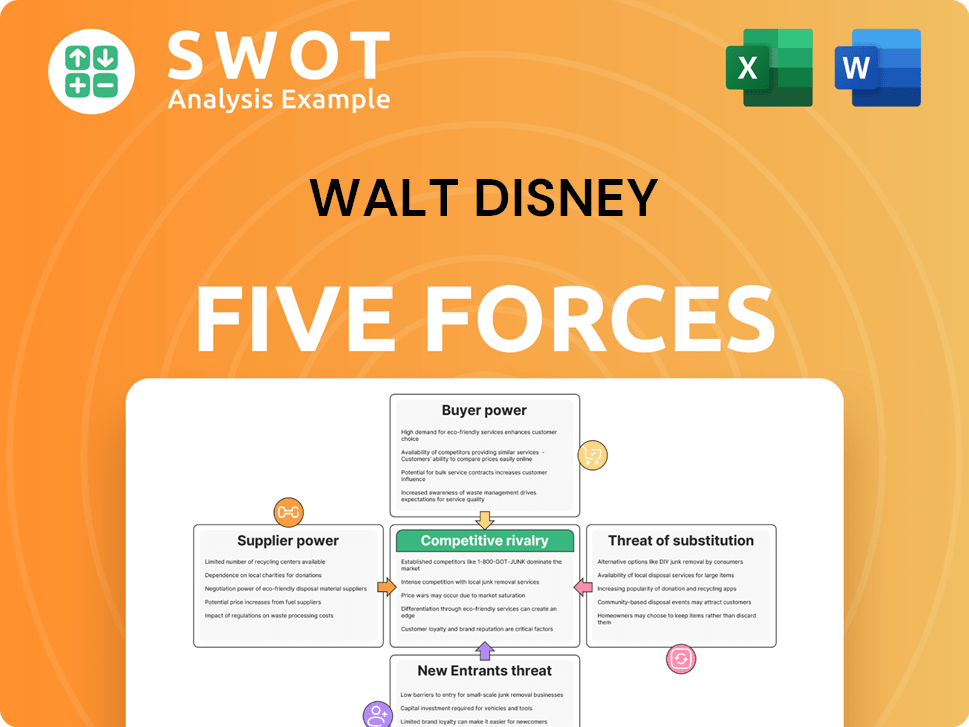
This preview showcases the complete Porter's Five Forces analysis of Walt Disney. It examines competitive rivalry, the power of suppliers, buyers, and potential new entrants, alongside threat of substitutes. You will receive this exact document upon purchase—fully formatted and ready for immediate use.

Porter's Five Forces Analysis Template
Elevate Your Analysis with the Complete Porter's Five Forces Analysis
Walt Disney operates within a dynamic entertainment landscape. Analyzing its competitive environment through Porter's Five Forces reveals complex pressures. Rivalry among existing firms, like streaming services, is intense. The bargaining power of suppliers, including content creators, is significant. Buyer power, from consumers, influences pricing strategies. Threats of new entrants and substitutes, such as alternative entertainment options, constantly challenge Disney. This brief snapshot only scratches the surface. Unlock the full Porter's Five Forces Analysis to explore Walt Disney’s competitive dynamics, market pressures, and strategic advantages in detail.
Suppliers Bargaining Power
Limited High-Quality Content Creators
Disney's dependence on a limited pool of high-quality content creators grants them considerable bargaining power. In 2023, content spending hit $33.1 billion, illustrating the value of these relationships. Top animation studios and storytellers can command favorable terms. Demand for compelling content strengthens their position further.
Significant Dependence on Talent Agencies
Disney heavily depends on talent agencies like CAA, WME, and UTA for creative professionals. These agencies control a large portion of Disney's talent pool, increasing their bargaining power. This dependence allows agencies to negotiate favorable terms for their clients. In 2024, Disney's content costs, significantly impacted by talent deals, reached billions of dollars.

High Costs of Specialized Technology
Disney's animation studios, including Pixar, depend on advanced tech for visual effects. This need for specialized technology strengthens suppliers like Autodesk and Adobe. These suppliers can leverage their critical roles to set favorable terms. In 2024, Adobe's revenue reached approximately $19.26 billion, indicating their market influence.
Vertical Integration Reduces Supplier Power
Disney's vertical integration significantly reduces supplier power. Owning studios like Pixar, Lucasfilm, and Marvel provides a competitive edge. This strategy minimizes reliance on external suppliers for content creation. Internal production capabilities offer greater control over quality and costs.
- Disney's revenue in 2024 was approximately $88.9 billion.
- Disney+ had about 150 million subscribers globally by late 2024.
- Pixar's "Inside Out 2" grossed over $1 billion worldwide in 2024.
Exclusive Licensing Agreements
Disney's exclusive licensing agreements significantly influence supplier power. These agreements, especially for franchises like Marvel and Star Wars, allow suppliers to demand higher prices. In 2022, Disney's licensing revenue hit approximately $4.2 billion, reflecting the financial impact of these deals.
- Exclusive licensing agreements boost supplier power.
- Franchises like Marvel and Star Wars are key.
- Suppliers can charge more for famous IPs.
- 2022 licensing revenue was roughly $4.2 billion.
Supplier Power Dynamics at the Entertainment Giant
Disney's bargaining power of suppliers varies. Key content creators and talent agencies like CAA have leverage, impacting content costs. Tech suppliers for VFX and exclusive licensing agreements also wield power. Vertical integration and content ownership, however, lessen this supplier influence.
| Factor | Impact | Financial Data (2024) |
|---|---|---|
| Content Creators | High bargaining power | Content spending at billions |
| Talent Agencies | Significant influence | Content costs impact $ |
| Tech Suppliers | Moderate leverage | Adobe revenue at approx. $19.26B |
Customers Bargaining Power
Diverse Consumer Base
Disney's diverse consumer base, spanning ages and cultures, amplifies customer power. This broad reach, from theme park visitors to streaming subscribers, necessitates catering to varied tastes. In 2024, Disney's global presence requires nuanced strategies to meet diverse consumer expectations. Satisfying these preferences impacts content development, marketing, and distribution, as seen in the $22.5 billion revenue from Disney Parks, Experiences and Products in Q1 2024.
High Expectations for Quality and Innovation
Customers hold Disney to high standards regarding quality and innovation. Disney's brand relies on delivering excellent experiences; failing to do so risks customer dissatisfaction. Maintaining high quality and innovation is key to retaining customer loyalty. In 2024, Disney's Parks, Experiences, and Products revenue was $32.9 billion, showing customer spending power.

Access to Information
Customers possess significant bargaining power due to readily available information. They can easily access reviews and compare Disney's offerings, such as theme park experiences and streaming content, with competitors. This access to data, including financial performance metrics, influences their choices. For example, in 2024, Disney's streaming services faced increased competition, impacting subscriber growth and pricing strategies.
Subscription Models Increase Switching Costs
Disney's streaming services, such as Disney+, employ subscription models, influencing customer bargaining power. While cancellations are easy, bundled services and exclusive content create switching barriers. Effective retention strategies are crucial. In Q1 2024, Disney+ had 150 million subscribers globally. This indicates a significant customer base.
- Subscription models create switching costs.
- Bundled offerings and exclusive content act as barriers.
- Customer retention is key to maintaining subscribers.
- Disney+ had 150 million subscribers in Q1 2024.
Social Media Influence
Social media significantly amplifies customer influence over Disney. Platforms allow customers to readily share opinions on Disney's offerings, impacting brand perception. Positive reviews can boost Disney's image, while negative feedback can quickly damage it. In 2024, Disney's social media engagement saw a 15% increase in interactions. Monitoring and responding to social media trends are vital for managing customer power effectively.
- Social media's impact on customer opinions.
- Rapid spread of feedback affecting Disney's brand.
- Importance of monitoring social media trends.
- 2024 saw 15% increase in social media interactions.
Customer Power: Shaping Revenue
Customers' access to information and diverse choices strengthens their bargaining power. Disney's subscription models and exclusive content affect this, but customer loyalty is still essential. Social media further amplifies customer influence. In 2024, customer spending supported $32.9 billion in Parks, Experiences, and Products revenue.
| Aspect | Impact | 2024 Data |
|---|---|---|
| Information Access | Influences choices and comparisons | Disney's streaming services faced competition |
| Subscription Models | Create switching barriers | Disney+ had 150M subscribers in Q1 2024 |
| Social Media | Amplifies customer opinions | 15% increase in social interactions |
Rivalry Among Competitors
Streaming Platform Competition
The streaming landscape is fiercely competitive, with Netflix, Amazon Prime Video, and Hulu as key rivals. Disney+ competes intensely for subscribers in this crowded arena. In Q4 2023, Netflix had 260.8 million paid memberships globally, while Disney+ reported 111.3 million. Strategic content, pricing, and user experience are crucial for survival. Disney+ is investing heavily in original content to stay competitive.
Media Production Landscape
The media production landscape is fiercely competitive, packed with numerous companies vying for audience attention. Disney battles giants like Warner Bros. Discovery and Comcast. In 2024, Disney's revenue was approximately $88.89 billion, while Warner Bros. Discovery generated around $42.05 billion. The pressure to stand out with unique, high-quality content is immense. This drives intense competition, impacting profitability.

Theme Park Competition
Disney's theme parks compete with Universal Studios and regional parks. Universal has invested heavily, with its Epic Universe set to open in 2025. Attendance figures show a competitive landscape; for example, in 2023, Disney World saw 20.3 million visitors. To stay competitive, Disney must innovate and offer unique guest experiences.
Strategic Acquisitions
Strategic acquisitions are common in entertainment. Disney's purchase of 21st Century Fox is a prime example. Such moves amplify rivalry, as bigger firms with varied content vie for viewers. The deal, valued at roughly $71.3 billion, significantly boosted Disney's assets.
- Disney's revenue in 2024 was approximately $88.89 billion.
- The acquisition of 21st Century Fox expanded Disney's content library considerably.
- Competitive intensity increases as companies consolidate and diversify.
- These acquisitions impact market share and consumer choice significantly.
Aggressiveness of Firms
The entertainment industry is fiercely competitive, with firms aggressively vying for market share through marketing and promotions. This high level of aggression significantly heightens competitive rivalry, compelling Disney to continually innovate. Aggressive marketing and content strategies are crucial for maintaining a competitive edge. Disney's success depends on its ability to outmaneuver rivals.
- Disney spent $3.55 billion on marketing in 2023, reflecting its aggressive promotional approach.
- Netflix, a major competitor, invested heavily in original content, spending approximately $17 billion in 2023 to attract and retain subscribers.
- Comcast's NBCUniversal, another key rival, has been aggressive in theme park expansions and content creation, investing billions annually.
Disney's $88.89B Revenue Faces Fierce Rivals
Competitive rivalry at Disney is intense, driven by numerous players. Major competitors include Netflix, Amazon, and Comcast. Disney’s 2024 revenue was $88.89B, yet competition is fierce.
| Aspect | Disney | Competitors (Examples) |
|---|---|---|
| Key Rivals | Disney+ | Netflix, Amazon Prime, Hulu, Comcast, Warner Bros. Discovery |
| Revenue (2024) | $88.89B | Netflix: $33.72B (2023), WBD: $42.05B (2024) |
| Marketing Spend (2023) | $3.55B | Netflix spent ~$17B on content (2023) |
SSubstitutes Threaten
Numerous Alternative Entertainment Platforms
Consumers face a vast array of entertainment choices, intensifying the threat of substitutes for Disney. Streaming services like Netflix and Amazon Prime Video offer competitive content. Social media platforms and video games also vie for consumer attention, diverting time and spending. The availability of these alternatives moderately impacts Disney's market position. In 2024, streaming subscriptions hit 1.5 billion globally, showing the scale of competition.
Rising Popularity of Mobile and Digital Entertainment
The surge in mobile and digital entertainment poses a threat to Disney. Mobile gaming and streaming services compete for consumer time and attention. The mobile entertainment market is predicted to hit $272.7 billion by 2030. This shift could lessen engagement with Disney's traditional media. Disney must adapt to stay competitive.

Increasing Competition from Gaming and Social Media Platforms
Gaming and social media platforms pose a growing threat to Disney. These platforms offer interactive entertainment, competing for consumer time. Independent creators and new media amplify this competition. Disney's 2024 revenue was $88.89 billion, yet must adapt to stay relevant. Incorporating new tech is vital to avoid losing market share.
Emerging Virtual and Augmented Reality Entertainment
Emerging virtual and augmented reality (VR/AR) entertainment experiences pose a growing threat to Disney. These immersive alternatives are becoming increasingly popular, potentially drawing audiences away from Disney's traditional offerings. The advancement of VR/AR could significantly impact demand for theme parks and movie experiences. Disney needs to actively invest in VR/AR to stay competitive.
- Global VR/AR market is projected to reach $68.6 billion by 2024.
- Disney has already made moves in VR/AR, including partnerships and content development.
- VR/AR entertainment offers direct competition for consumer time and spending.
- Successful adoption of VR/AR by Disney could lead to new revenue streams.
Price Sensitivity
Consumers show price sensitivity, often opting for cheaper or free entertainment over Disney's offerings. The availability of substitutes elevates the threat, especially in economic downturns. Disney+ costs $13.99 monthly. This impacts revenue.
- Price Sensitivity: Consumers may choose cheaper options.
- Substitute Availability: Free or low-cost alternatives exist.
- Economic Impact: Substitution increases during downturns.
- Disney+ Price: Monthly subscription is $13.99.
Entertainment Shifts: New Rivals Emerge
Substitutes like streaming, gaming, and social media challenge Disney's market position. The global gaming market hit $200 billion in 2023. VR/AR entertainment, projected at $68.6 billion by 2024, also competes. Price sensitivity further fuels substitution.
| Substitute | Impact | Data (2024 est.) |
|---|---|---|
| Streaming | High competition | 1.5B subs |
| Gaming | Time/Spending | $272.7B mkt (by 2030) |
| VR/AR | Immersive alternatives | $68.6B mkt |
Entrants Threaten
High Capital Requirements
The entertainment industry demands hefty investments in content creation and distribution, creating a significant barrier for new entrants. Disney, with its vast resources, can outspend rivals, making it tough for newcomers. High capital costs, including production and marketing, limit the ability of new competitors to enter the market. In 2024, Disney's capital expenditures were substantial, reflecting its ongoing investments in parks and content. New entrants face a tough financial hurdle to compete with such established giants.
High Cost of Brand Development
Developing a recognizable brand in entertainment is costly and time-consuming. Disney's brand strength and consumer trust pose a challenge for new entrants. The expense of building a media brand is a significant entry barrier. In 2024, Disney's brand value was estimated at over $50 billion, highlighting the financial hurdle. New companies must invest heavily in marketing to compete.

Low Switching Costs
Low switching costs significantly amplify the threat of new entrants in entertainment. Customers can readily shift to alternative streaming services or entertainment options. This ease of switching undermines Disney's market position. In 2024, the global streaming market saw increased competition, with subscriber churn rates rising. This indicates a heightened threat from new entrants.
Established Brand Loyalty
Disney's strong brand loyalty significantly deters new entrants. This loyalty stems from its iconic characters, theme parks, and films deeply rooted in popular culture. Disney's established presence offers a considerable advantage in consumer appeal. As of 2023, Disney+ boasts over 162 million subscribers globally, illustrating its strong market position.
- Iconic characters and franchises build lasting consumer connections.
- Theme parks and resorts create immersive brand experiences.
- Disney+ subscriber base reflects high consumer loyalty.
- Brand recognition reduces vulnerability to new competitors.
Economies of Scale
Disney's massive scale provides significant cost advantages, making it tough for newcomers. They produce and distribute content more cheaply than smaller rivals. This ability to offer lower prices is a major barrier to entry. Disney's diverse offerings, from streaming to theme parks, cater to various consumer tastes.
- Economies of scale allow Disney to spread costs across a vast consumer base, reducing per-unit expenses.
- New entrants struggle to match Disney's pricing due to higher production and distribution costs.
- Disney's brand recognition and market power further solidify its competitive edge.
- In 2024, Disney's revenue from Parks, Experiences and Products was $32.7 billion, demonstrating its scale.
Disney's Dominance: Barriers to Entry
The entertainment industry’s high capital requirements and brand-building costs form substantial barriers to entry. Disney's established brand and economies of scale offer considerable advantages, making it difficult for new entrants to compete effectively. In 2024, the company's large investments in theme parks and content production solidified its market dominance.
| Factor | Impact on New Entrants | Disney's Advantage (2024 Data) |
|---|---|---|
| Capital Costs | High investment needed for content and distribution. | Expenditures in Parks, Experiences, and Products: $32.7B |
| Brand Recognition | Costly and time-consuming to build a media brand. | Brand value estimated over $50B. |
| Switching Costs | Low switching costs allow customers to change quickly. | Disney+ subscriber base of over 162M. |
Porter's Five Forces Analysis Data Sources
Walt Disney's Porter's analysis is built on annual reports, industry reports, and SEC filings to examine competition.
