W&T Offshore Boston Consulting Group Matrix
Fully Editable
Tailor To Your Needs In Excel Or Sheets
Professional Design
Trusted, Industry-Standard Templates
Pre-Built
For Quick And Efficient Use
No Expertise Is Needed
Easy To Follow
W&T Offshore Bundle
What is included in the product
W&T Offshore's BCG Matrix analysis evaluates its portfolio, offering strategic insights for each quadrant.
Clean, distraction-free view optimized for C-level presentation.
What You See Is What You Get
W&T Offshore BCG Matrix
The preview you're viewing is the complete W&T Offshore BCG Matrix you'll receive. Upon purchase, you'll get the fully editable file, free of any watermarks or hidden content. This professionally designed report is ready for immediate strategic application within your organization. The same document can be downloaded immediately, directly to your device.

BCG Matrix Template
See the Bigger Picture
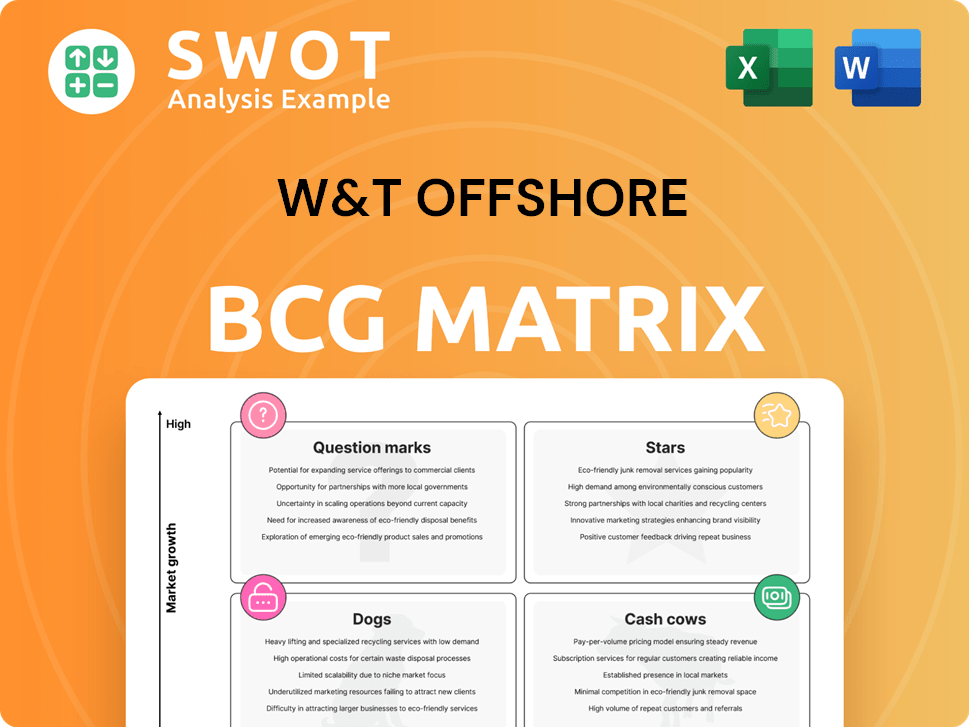
W&T Offshore's BCG Matrix unveils its portfolio's strategic landscape. This snapshot hints at how each product fares in market growth and share. Discover potential "Stars," "Cash Cows," "Dogs," and "Question Marks." Understanding these quadrants is vital for resource allocation. This preview barely scratches the surface.
Get instant access to the full BCG Matrix and discover which products are market leaders, which are draining resources, and where to allocate capital next. Purchase now for a ready-to-use strategic tool.
Stars
Accretive Acquisitions
W&T Offshore utilizes accretive acquisitions to enhance its portfolio. In January 2024, the company acquired six shallow water Gulf of Mexico fields. These acquisitions boost reserves and production, generating immediate cash flow. For example, in Q1 2024, W&T Offshore's production increased. This strategy aligns with its growth objectives.
Operational Excellence
W&T Offshore excels in operational efficiency, especially with low-cost well workovers and recompletions. These efforts boost production and revenue from existing wells. In 2024, W&T Offshore's capital expenditures were approximately $147.4 million, reflecting its focus on operational improvements. Their quick integration of new fields for safety and efficiency is a major advantage.

Deepwater Expertise
W&T Offshore excels in deepwater operations within the Gulf of Mexico, a technically demanding area. Their experience allows them to pursue high-impact drilling, with deepwater assets making up a large part of their holdings. In 2024, deepwater production contributed significantly to their overall output, representing a key revenue source. This expertise is crucial for capitalizing on future opportunities in this sector.
Reserve Replacement
W&T Offshore's "Stars" status in the BCG Matrix is supported by its impressive reserve replacement capabilities. In 2024, W&T Offshore showcased its strong ability to replenish reserves, achieving a 219% replacement rate. This indicates the company's dedication to sustained growth and operational excellence. This performance is a key indicator of the company's future potential.
- 219% Reserve Replacement Rate (2024)
- Focus on exploration and acquisitions
- Operational improvements
Strategic Cost Management
W&T Offshore, categorized as a "Star" in the BCG matrix, excels in strategic cost management. They actively manage costs to boost profitability and cash flow. Synergies from acquisitions and efficient operations significantly enhance their financial outcomes. Their commitment to cost control is evident in lower lease operating expenses (LOE) than initially projected.
- 2024 Q1 LOE was $23.37 per BOE, below guidance.
- Focused on efficiency to optimize financial performance.
- Synergies from acquisitions are a key part of cost management.
- Strong financial performance reflects effective cost control.
Offshore's Stellar 2024: Reserve Growth & Cost Control!
W&T Offshore is a "Star" due to its strong reserve replacement and strategic cost management. In 2024, it achieved a 219% reserve replacement rate. This underscores robust growth and operational prowess. Its financial performance showcases successful cost controls.
| Metric | Details | 2024 Data |
|---|---|---|
| Reserve Replacement Rate | Percentage of reserves replaced annually | 219% |
| Q1 2024 LOE | Lease Operating Expenses | $23.37/BOE |
| Capital Expenditures | Operational Improvements | $147.4M |
Cash Cows
Conventional Shelf Assets
W&T Offshore's conventional shelf assets in the Gulf of Mexico offer a steady foundation for production and cash flow. The company holds a significant presence in this area, with around 493,000 gross acres. These assets generally exhibit lower decline rates, demanding less capital compared to deepwater projects. In 2024, W&T Offshore's production from these assets was approximately 30,000 barrels of oil equivalent per day.
Mobile Bay Operations
Mobile Bay assets, historically 40% of W&T's production, function as a cash cow when stable. Production normalization supports cash flow. A $58.5 million insurance settlement for the Mobile Bay 78-1 well casualty loss strengthens the cash position. In 2024, focus remains on optimizing these assets.

Established Infrastructure
W&T Offshore's established infrastructure in the Gulf of Mexico, including pipelines and processing facilities, is a major advantage. This existing infrastructure significantly cuts down on transportation expenses and boosts operational effectiveness. Their proximity to current operations enables them to capitalize on synergies related to personnel, well optimization, and gathering and transport. W&T Offshore's production in Q3 2023 was 37.4 thousand barrels of oil equivalent per day (MBoe/d). This infrastructure supports their ability to maintain and grow production.
Hedging Program
W&T Offshore's hedging program is crucial for managing price risks and securing cash flow, a key aspect of its "Cash Cows" status within the BCG matrix. In 2024, the company strategically employed Henry Hub costless collars for natural gas, showcasing a proactive stance against commodity price fluctuations. This strategy helps stabilize revenue streams, which is essential for maintaining profitability and investor confidence. Hedging is critical for W&T Offshore.
- In Q1 2024, W&T Offshore reported approximately $180 million in revenues, partially supported by its hedging strategies.
- The use of Henry Hub collars is designed to protect against significant drops in natural gas prices, ensuring a more predictable revenue stream.
- Hedging programs can cover up to 75% of projected production volumes.
Dividend Payments
W&T Offshore's dividend payments reflect its financial health and dedication to shareholders. The company's consistent quarterly dividends, like the $0.01 per share declared for Q1 2024, highlight its stability. These payments are backed by the cash flow from its producing assets. W&T Offshore's commitment to dividends is a key aspect of its "Cash Cow" status.
- Q1 2024 dividend: $0.01 per share.
- Consistent quarterly payments.
- Supported by producing assets' cash flow.
- Reflects financial stability.
Offshore Oil's Financial Highlights: Production, Revenue, and Dividends
Cash cows for W&T Offshore include stable production from assets, especially in the Gulf of Mexico. In 2024, their production from these assets was roughly 30,000 barrels of oil equivalent per day. A strong hedging strategy, like using Henry Hub collars, stabilizes revenue. Dividend payments, such as the Q1 2024 dividend of $0.01 per share, demonstrate financial health.
| Aspect | Details |
|---|---|
| Revenue (Q1 2024) | Approximately $180 million |
| Hedging Strategy | Henry Hub costless collars |
| Dividend (Q1 2024) | $0.01 per share |
Dogs
Non-Core Asset Sales
W&T Offshore actively sells off assets that aren't central to its main production or cash flow goals. For example, in January 2025, they sold a non-core interest in Garden Banks Blocks 385 and 386. These assets typically have restricted growth opportunities, which can negatively impact overall financial results. By offloading these, W&T Offshore improves its focus and financial efficiency. In 2024, the company's total revenues were $838.6 million.
Fields with Operational Issues
Some acquired fields may struggle initially due to operational snags or conflicts with midstream partners. The early 2024 production halt at some Cox Oil Offshore fields exemplifies this. Turning around these fields demands substantial investment and meticulous management. For instance, W&T Offshore's operational expenses in 2024 rose, reflecting these challenges.

High Decline Rate Properties
Some of W&T Offshore's older assets face high decline rates, diminishing production and cash flow. These properties demand continuous investment to sustain output. Without strategic action, these assets may consume resources. In 2024, W&T Offshore's proved reserves were 136.3 million barrels of oil equivalent (MMboe).
Assets Impacted by Hurricanes
Production disruptions from Gulf of Mexico hurricanes hit some assets hard. These events cause temporary shutdowns, cutting into revenue. W&T Offshore relies on insurance, yet operations still face disruption. The 2024 hurricane season saw significant impacts.
- Hurricane-related production shut-ins can significantly reduce oil and gas output.
- Insurance helps, but doesn't eliminate all operational impacts.
- Revenue streams are directly affected by production downtime.
- The financial effects include lost sales and increased operational expenses.
High-Cost, Low-Production Wells
High-cost, low-production wells, or 'dogs,' are a concern. These wells often need costly workovers or recompletions to boost output. If these attempts fail, plugging and abandonment becomes the only option. This can lead to significant financial losses for the company.
- In 2024, the average cost to plug and abandon an offshore well was approximately $10-15 million.
- Workovers and recompletions can range from $1 million to over $10 million per well.
- Low production rates result in lower revenues, potentially hindering the company's profitability.
Offshore Oil Wells: High Costs, Low Returns
Dogs, in W&T Offshore's portfolio, include high-cost, low-production wells. These assets often need costly interventions, like workovers, or may require abandonment. Abandoning a well could cost $10-15 million in 2024. These factors negatively affect W&T's profitability.
| Issue | Impact | 2024 Data |
|---|---|---|
| High Costs | Workovers, recompletions, abandonment | $10-15M/abandonment, $1-10M+ /workover |
| Low Production | Reduced revenues | Dependent on well specifics |
| Financial Strain | Lower profitability | Operational expenses increased |
Question Marks
Undeveloped Deepwater Leases
W&T Offshore's undeveloped deepwater leases in the Gulf of Mexico are a "question mark" in its BCG matrix. These leases, holding potential, need hefty investment for exploration. Joint ventures could be explored for development. In 2024, the company invested $50 million in exploration activities.
'Holy Grail' Prospect
The 'Holy Grail' prospect is a proven, undeveloped well in the Garden Banks area, presenting high potential. W&T Offshore delayed drilling until 2025, possibly seeking a joint venture. Success is uncertain, reflecting high risk. In 2024, exploration expenses were $15.2 million.

New Acquisition Integration
Newly acquired assets, like the GOA fields purchased in January 2024, are 'question marks'. These need investment and management. The integration is complex, consuming time. W&T Offshore's 2024 Q1 earnings show this, with focus on these assets.
Exploration Projects
W&T Offshore's exploration projects in the Gulf of Mexico are classified as question marks, representing high-risk, high-reward ventures. These projects demand substantial initial capital with no guarantee of success. The future of these projects is highly dependent on the company's exploration success rate. In 2024, W&T Offshore allocated a significant portion of its capital towards exploration activities.
- High risk, high reward exploration ventures.
- Require significant upfront investment.
- Success depends on exploration success rate.
- Significant capital allocated in 2024.
Potential Drilling Joint Ventures
Exploring drilling joint ventures, like the Monza Energy LLC joint venture, positions W&T Offshore as a question mark in the BCG matrix. These ventures can be beneficial, injecting capital and specialized expertise into projects. However, they also mean sharing profits and control, creating potential strategic complexities. The success hinges on the specific terms of the agreements and the operational performance of the collaborative projects. In 2024, W&T Offshore's financial decisions, including joint ventures, will significantly influence its market position.
- Joint ventures provide capital and expertise.
- They also involve sharing profits and control.
- Success depends on agreement terms and project performance.
- Financial decisions in 2024 will impact market position.
Offshore Ventures: Millions at Stake
Question marks are high-risk ventures requiring significant investment. Success hinges on exploration and strategic partnerships. W&T Offshore's 2024 exploration spending was substantial.
| Aspect | Details | 2024 Data |
|---|---|---|
| Exploration Investment | Capital allocation for high-risk projects | $50M |
| Holy Grail Expenses | Costs associated with a specific prospect | $15.2M |
| Joint Ventures | Strategic partnerships to share risk and expertise | Ongoing, impact 2024 financials |
BCG Matrix Data Sources
Our BCG Matrix leverages dependable data: company filings, market intelligence reports, and competitor analyses for robust insights.
