XTB Porter's Five Forces Analysis
Fully Editable
Tailor To Your Needs In Excel Or Sheets
Professional Design
Trusted, Industry-Standard Templates
Pre-Built
For Quick And Efficient Use
No Expertise Is Needed
Easy To Follow
XTB Bundle
What is included in the product
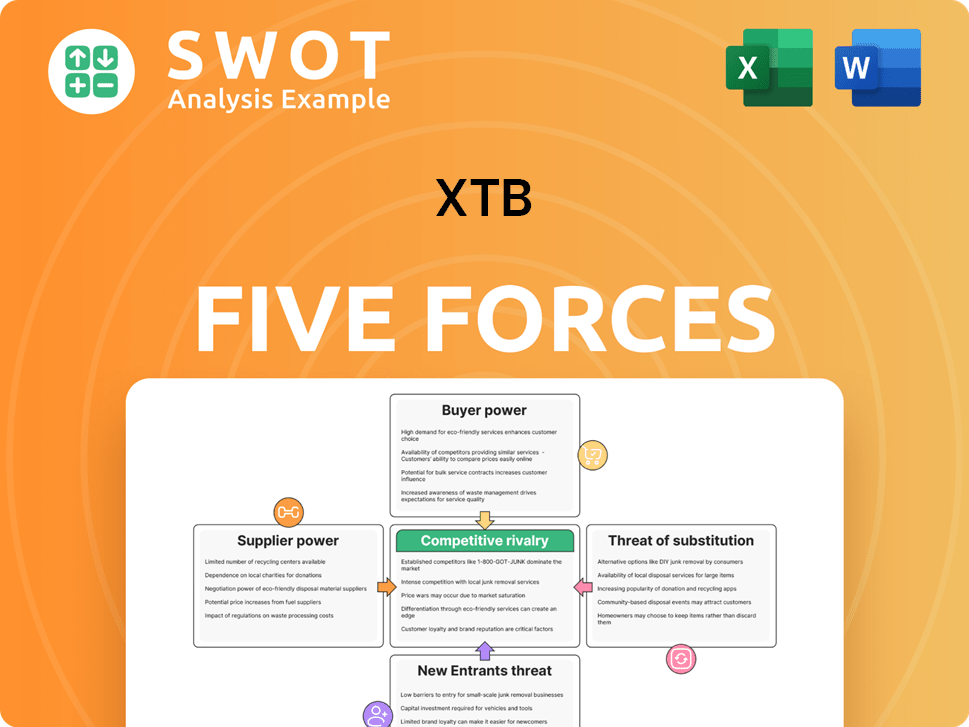
Analyzes XTB's competitive landscape, including threats, power dynamics, and market entry.
Instantly see your industry's competitive landscape with a comprehensive summary chart.
What You See Is What You Get
XTB Porter's Five Forces Analysis
This preview presents the complete XTB Porter's Five Forces analysis. It details competitive rivalry, supplier & buyer power, and threats of new entrants & substitutes. The document you're viewing is the same professionally written analysis you'll receive after your purchase. It's fully formatted and ready for immediate use. There are no hidden changes or alterations. This is the final version—ready to download and implement.

Porter's Five Forces Analysis Template
Go Beyond the Preview—Access the Full Strategic Report
XTB's industry faces moderate rivalry, with established brokers vying for market share. Buyer power is relatively low due to a fragmented customer base. Supplier power (technology providers) has a moderate impact. The threat of new entrants is moderate, balanced by regulatory hurdles. Substitute threats (other investment platforms) pose a notable challenge.
This brief snapshot only scratches the surface. Unlock the full Porter's Five Forces Analysis to explore XTB’s competitive dynamics, market pressures, and strategic advantages in detail.
Suppliers Bargaining Power
Supplier Concentration
In the online brokerage industry, the concentration of suppliers, like technology providers for trading platforms and data feeds, can significantly influence a firm's profitability. If these suppliers are few in number, they can exert considerable pricing power. For example, a 2024 report showed that the top three data feed providers control over 70% of the market share. XTB's proprietary xStation 5 platform helps, but reliance on external data feeds remains.
Switching Costs for XTB
Switching costs for XTB to change suppliers might be substantial, especially if their platform relies on specific technologies. This dependency strengthens the suppliers' position. XTB's in-house development could reduce reliance on external vendors. For example, in 2024, XTB spent approximately $15 million on technology and development, indicating efforts to control its tech stack.

Availability of Substitute Suppliers
The availability of substitute suppliers significantly impacts XTB's bargaining power. Numerous providers offering similar services empower XTB to negotiate favorable terms, potentially lowering costs. The fintech sector's expansion may increase supplier options, but their quality and reliability are key considerations. In 2024, XTB spent approximately $15 million on external technology and service providers.
Supplier's Ability to Integrate Forward
XTB faces a potential threat if its suppliers, particularly those offering technology or financial services, integrate forward. Established financial institutions, which might also provide technology, pose a greater risk. This could involve offering brokerage services directly, bypassing XTB. However, pure technology suppliers are less likely to do this.
- Forward integration reduces XTB's control over its value chain.
- Established financial institutions have the resources for forward integration.
- Technology providers may lack the necessary customer base and regulatory approvals.
- The competitive landscape could shift with a supplier entering the market.
Impact of Supplier Costs on XTB's Profitability
Supplier costs significantly influence XTB's operational expenses, impacting profitability. Suppliers gain power when their services are crucial and costly for XTB. As a low-cost trading platform, XTB is sensitive to supplier pricing, making this force relevant. For instance, technology and data providers are essential suppliers. In 2024, XTB's operating expenses were approximately EUR 170 million.
- Technology and data services are critical suppliers.
- XTB's low-cost model heightens sensitivity to supplier prices.
- In 2024, operating expenses were around EUR 170 million.
- Supplier power is a key consideration.
XTB's Tech & Data: Costs & Control
Suppliers of tech and data significantly impact XTB's costs and control. Concentrated suppliers, like data feed providers, have pricing power. XTB's efforts to control its tech stack, with $15 million spent in 2024, aim to reduce reliance.
| Aspect | Impact | 2024 Data |
|---|---|---|
| Supplier Concentration | Higher prices, less control | Top 3 data providers: 70%+ market share |
| Switching Costs | High, strengthens suppliers | Tech and development: ~$15M |
| Substitute Availability | More options, better terms | External tech/services: ~$15M |
Customers Bargaining Power
Customer Switching Costs
Low switching costs significantly boost customer power. The online brokerage sector sees easy account transfers, intensifying competition. In 2024, average transfer times are under a week. This forces XTB to offer superior value.
Customer Price Sensitivity
Customers in online brokerage significantly influence pricing. Price sensitivity is high, amplified by commission-free trading. This empowers customers, demanding competitive rates and extra services. In 2024, platforms like Robinhood and Webull saw massive growth, showcasing this price-driven trend.

Availability of Information
Customers' easy access to information heavily influences XTB. Online platforms offer comprehensive broker comparisons, impacting customer decisions. For example, in 2024, over 70% of retail traders research brokers online before investing. This increased transparency allows clients to negotiate and seek better terms.
Customer Concentration
XTB's customer base is vast, primarily composed of individual investors, which inherently limits the bargaining power of any single client. This broad distribution of customers means that XTB is not heavily reliant on any one individual or small group for its revenue. In 2024, XTB reported over 900,000 active clients, which showcases its extensive reach across retail investors. Institutional clients, managing larger trading volumes, potentially possess more negotiating leverage.
- XTB's retail focus dilutes the impact of individual client actions.
- Institutional clients might negotiate better terms due to volume.
- In 2024, XTB's active client base exceeded 900,000.
- XTB's revenue is diversified across a wide customer base.
Differentiation of Services
Differentiation is key for XTB. By offering unique features, like the xStation 5 platform, and educational resources, XTB aims to make its services stand out. This strategy can reduce customer price sensitivity. Strong differentiation builds customer loyalty, which weakens buyer power.
- XTB's xStation 5 platform offers advanced charting tools and market analysis.
- The Trading Academy provides educational content, including webinars and courses.
- In 2024, XTB reported over 900,000 active clients globally.
- Customer satisfaction scores are closely monitored to gauge the effectiveness of differentiation efforts.
XTB: Customer Power & Market Dynamics
Customer bargaining power significantly shapes XTB's market position. Low switching costs empower clients; account transfers are swift. Price sensitivity, heightened by commission-free trading, pressures rates. In 2024, market dynamics saw robust growth, highlighting this.
| Factor | Impact | 2024 Data |
|---|---|---|
| Switching Costs | Low, boosting customer power | Account transfers under a week |
| Price Sensitivity | High, due to commission-free options | Robinhood, Webull growth |
| Information Access | High, enables broker comparison | 70%+ retail research brokers online |
Rivalry Among Competitors
Number of Competitors
The online brokerage sector is fiercely competitive, hosting many firms providing comparable services. In 2024, XTB contends with rivals like eToro and Interactive Brokers. This competition pushes XTB to stand out and offer attractive pricing to secure market share.
Industry Growth Rate
The e-brokerage industry is booming. It's fueled by more internet access and demand for tailored investment options. This expansion draws in new companies, increasing competition for firms like XTB. The market is projected to reach $12.79 billion in 2024, with an 8.32% CAGR from 2024-2032.

Product Differentiation
Online brokers compete by differentiating core services. Features, assets, education, and support set them apart. XTB’s xStation 5 platform and educational tools give it an edge. For example, in 2024, XTB expanded its educational content by 20%. This helps attract and retain clients.
Switching Costs
Low switching costs significantly heighten competitive rivalry. Online brokers like XTB face intense competition because clients can readily switch platforms. To maintain its market position, XTB must consistently innovate and offer exceptional value. This includes competitive pricing and a wide range of trading instruments.
- In 2024, the average cost to switch brokers remained low, around $0-$100, depending on asset transfers.
- XTB's active clients grew by 28.7% in Q1 2024, showing their ability to attract and retain clients.
- The trend towards zero-commission trading increases the importance of other value-added services.
- Competition among brokers intensified as they compete for market share.
Exit Barriers
Exit barriers in the online brokerage industry are generally low, fostering competition because weaker firms might stay rather than exit, intensifying rivalry. Regulatory demands and reputation concerns do create some barriers, but these are often manageable. For example, in 2024, several smaller brokerages merged or were acquired, showing the fluidity of market participants. This constant reshuffling increases competition.
- Low exit barriers can keep struggling firms in the market.
- Regulatory requirements and reputation create some barriers.
- Mergers and acquisitions are common in the industry.
- This fluidity enhances competition.
Brokerage Battle: Low Costs, High Stakes
Competitive rivalry in the online brokerage sector is high, with numerous firms vying for clients, which increases competition. This is fueled by low switching costs, making it easier for clients to move between platforms. This encourages firms like XTB to innovate and offer competitive services.
| Metric | Value (2024) | Source |
|---|---|---|
| Average Cost to Switch Brokers | $0-$100 (asset transfers) | Industry Reports |
| XTB Active Client Growth (Q1) | 28.7% | XTB Financials |
| Market Size (e-brokerage) | $12.79 billion | Market Research |
SSubstitutes Threaten
Alternative Investment Options
Investors have many choices. Robo-advisors like Betterment and Wealthfront saw assets grow, with Betterment managing over $30 billion by late 2024. Traditional advisors and real estate also compete with online brokers. These alternatives can draw customers if they provide better services or fit specific needs. For example, in 2024, real estate investment trusts (REITs) offered attractive yields.
Robo-Advisors
Robo-advisors present a threat by providing automated investment services at lower costs, attracting budget-conscious investors. XTB must highlight its unique value compared to these automated platforms. In 2024, robo-advisors managed over $1 trillion globally, showcasing their growing popularity. XTB must differentiate itself through personalized advice and advanced tools.

Traditional Financial Advisors
Traditional financial advisors pose a threat as some investors seek personalized guidance. XTB must highlight its self-directed trading benefits. In 2024, the wealth management market was valued at approximately $121.4 trillion. XTB should emphasize cost-effectiveness versus advisor fees.
Other Trading Platforms
Other trading platforms pose a threat to XTB, especially those focusing on specific assets. Platforms like Coinbase, specializing in cryptocurrencies, can attract investors. XTB counters this by offering CFDs across various asset classes, aiming to retain its user base. This diversification is crucial in a competitive market.
- Coinbase reported $1.23 billion in revenue in Q1 2024.
- XTB's revenue for Q1 2024 was $124.7 million.
- The global CFD market is projected to reach $10.8 billion by 2029.
Low Cost Index Funds
Low-cost index funds pose a significant threat to XTB. These passive investment options, including ETFs, are appealing substitutes, particularly for buy-and-hold investors. XTB must offer strong incentives for active trading to compete effectively. The growth in passive investing is evident: in 2024, passive funds attracted substantial inflows.
- In 2024, passive funds saw significant inflows, reflecting their growing popularity.
- XTB must highlight unique features like advanced trading tools to attract active traders.
- Competitive pricing is crucial, as lower fees in passive funds are a key advantage.
XTB's Rivals: Robo-Advisors, Advisors, and ETFs
The threat of substitutes is high for XTB. Robo-advisors and traditional advisors offer alternative investment routes, competing for the same investors. Low-cost index funds, like ETFs, also pose a challenge by providing cost-effective passive investment options.
| Substitute | Description | Impact on XTB |
|---|---|---|
| Robo-advisors | Automated, low-cost investment platforms (Betterment, Wealthfront). | Attracts budget-conscious investors, may erode XTB's market share. |
| Traditional Advisors | Offer personalized financial guidance. | May draw investors seeking custom advice. |
| Index Funds/ETFs | Passive investment options with lower fees. | Offers a simpler, cheaper alternative. |
Entrants Threaten
Barriers to Entry
The online brokerage industry sees moderate barriers to entry. Technology has decreased some costs, but regulatory compliance is still tough. For instance, in 2024, new brokerages must meet stringent SEC and FINRA rules. Brand building and customer acquisition are costly, with marketing expenses reaching millions.
Capital Requirements
New entrants face high capital demands for platforms, regulatory compliance, and customer acquisition. XTB's established status provides economies of scale and brand strength, creating a barrier. In 2024, XTB reported a net profit of PLN 494.8 million, showcasing its financial advantage. This financial stability allows XTB to withstand competitive pressures more effectively.

Regulatory Hurdles
Regulatory hurdles significantly impact the online brokerage industry. New entrants face intricate legal and compliance demands, increasing the barrier to entry. XTB's established presence under diverse regulatory frameworks, such as those in the EU and UK, gives it a competitive edge. This experience allows XTB to efficiently adapt to evolving regulations. For example, in 2024, XTB's compliance costs were approximately 15% of its operational expenses.
Technology and Innovation
New entrants in the trading market must bring innovative technology and easy-to-use platforms to challenge existing brokers like XTB. Continuous innovation is essential for XTB to stay ahead. Competition is fierce, with fintech companies constantly improving their offerings. In 2024, the investment in fintech globally reached $46.2 billion, highlighting the importance of technological advancements.
- The global fintech market is projected to reach $324 billion by 2026.
- XTB's revenue in Q3 2024 was $112.8 million, showing its strong market position.
- New platforms must offer superior trading tools and analytics.
- User experience is a key differentiator for new entrants.
Brand and Reputation
Brand and reputation are crucial in the online brokerage sector. XTB's strong brand and positive reputation act as a significant entry barrier for new competitors. Building trust and recognition takes time and resources, making it hard for newcomers to quickly gain market share. Established players like XTB benefit from existing customer loyalty and positive word-of-mouth.
- XTB has a global presence, operating in over 13 countries.
- XTB's strong brand recognition helps retain customers.
- New entrants struggle to instantly match XTB's reputation.
- The established trust is a key competitive advantage.
XTB's Fortress: Barriers to Entry
The threat of new entrants to XTB is moderate, thanks to the industry's barriers. High capital needs and regulatory compliance pose challenges for newcomers. XTB's robust financial standing and brand recognition provide a competitive edge.
| Factor | Impact on XTB | Data Point (2024) |
|---|---|---|
| Capital Requirements | High Barrier | Fintech investment $46.2B globally |
| Regulatory Compliance | Significant Barrier | Compliance costs approx. 15% of expenses |
| Brand & Reputation | Competitive Advantage | Q3 Revenue: $112.8M |
Porter's Five Forces Analysis Data Sources
The XTB Porter's Five Forces Analysis utilizes diverse data sources. These include financial statements, market research, and regulatory filings. We also use competitive analysis and industry reports.
