Zynex Boston Consulting Group Matrix
Fully Editable
Tailor To Your Needs In Excel Or Sheets
Professional Design
Trusted, Industry-Standard Templates
Pre-Built
For Quick And Efficient Use
No Expertise Is Needed
Easy To Follow
Zynex Bundle
What is included in the product
BCG Matrix analysis of Zynex units, highlighting investment, holding, and divestment strategies.
Export-ready design for quick drag-and-drop into PowerPoint, delivering pain-free presentations.
What You See Is What You Get
Zynex BCG Matrix
The Zynex BCG Matrix preview mirrors the final, downloadable report. You'll get the complete, editable document instantly after purchase, ready for strategic application and analysis.

BCG Matrix Template
See the Bigger Picture
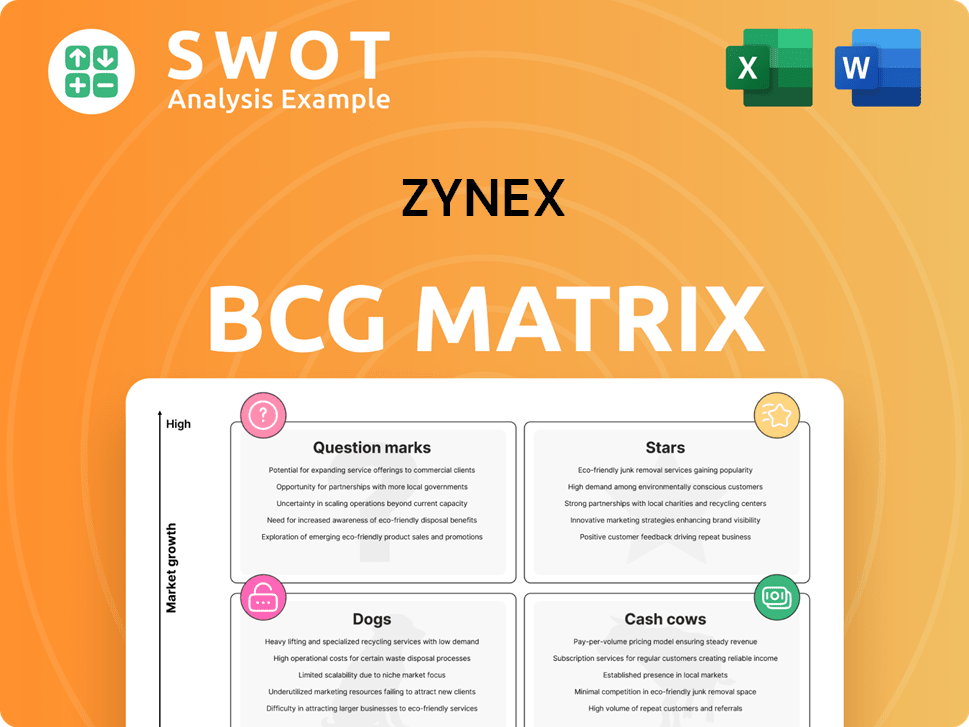
Uncover Zynex's product portfolio with a glance at its preliminary BCG Matrix insights. Explore the potential of its Stars and the stability of its Cash Cows. Understand the challenges posed by Question Marks and the struggles of the Dogs. This brief overview is just a snapshot of a complex landscape. Purchase the full BCG Matrix for detailed quadrant placements, data-driven recommendations, and strategic roadmaps to navigate Zynex's market position.
Stars
NexWave Device
The NexWave device, Zynex's leading electrotherapy product, is a Star in their BCG matrix. It excels in the pain management market due to its versatile, multi-modality features. In 2024, the NexWave accounted for a significant portion of Zynex's revenue, demonstrating strong market demand. The company continues to innovate, expanding its applications and market reach. This strategic focus solidifies its position as a key revenue driver.
New Therapy Products
Zynex's move into new therapy products, such as braces and cold therapy devices, broadens its offerings. This expansion complements the NexWave, boosting revenue within the pain management sector. In 2024, Zynex's revenue grew, with new products contributing to this increase. These additions enhance Zynex's market presence.

Partnership with VA Medical Centers
Zynex's collaboration with VA Medical Centers opens a major avenue to provide non-opioid pain solutions to veterans. In 2024, the VA served over 9 million enrolled veterans. This partnership aligns with the growing demand for alternatives to opioids, potentially boosting Zynex's revenue. This strategy could position Zynex favorably within the VA healthcare system.
TensWave Device
The TensWave device, a recent addition to Zynex's portfolio, is categorized as a "Star" within the BCG Matrix. This device, cleared by the FDA, provides TENS therapy in a portable and user-friendly format, enhancing patient accessibility to pain relief. It broadens Zynex's market presence by targeting patients with insurance coverage specifically for TENS therapy, complementing the NexWave device. In 2024, Zynex reported a revenue of $150 million, showing the potential of devices like TensWave to contribute to the company's growth.
- FDA Clearance: Provides regulatory validation and market entry.
- User-Friendly Design: Enhances patient compliance and satisfaction.
- Market Expansion: Targets specific insurance coverage for TENS therapy.
- Revenue Contribution: Supports Zynex's financial performance.
M-Wave Neuromuscular Electrical Stimulation (NMES) Device
The M-Wave device, cleared by the FDA, is a key product for Zynex, focusing on muscle stimulation for rehabilitation. This device supports patients recovering from injuries or surgeries, expanding Zynex's market reach. It diversifies revenue, contributing to the company's growth in the rehabilitation sector and enhancing its market position. Zynex reported revenues of $38.5 million in Q3 2023.
- FDA-cleared for muscle stimulation.
- Supports post-injury and post-surgery recovery.
- Expands Zynex's product offerings.
- Contributes to revenue diversification.
Zynex's Revenue Surge: NexWave, TensWave, and M-Wave Lead
Zynex's "Stars" like NexWave, TensWave, and M-Wave devices drive growth. In 2024, these products boosted Zynex's revenue. The company's strategic moves in new products show their strong market position.
| Product | 2024 Revenue (approx.) | Market Focus |
|---|---|---|
| NexWave | $100M+ (estimated) | Pain Management |
| TensWave | $20M+ (estimated) | TENS Therapy |
| M-Wave | $10M+ (estimated) | Muscle Stimulation |
Cash Cows
Electrodes and Supplies
Electrodes and supplies for the NexWave device are a Cash Cow for Zynex, ensuring recurring revenue. This steady income stems from the existing NexWave device base. In 2024, this segment likely contributed a significant portion of Zynex's revenue. This predictable revenue needs minimal promotion.
Private Labeled Rehabilitation Products
Zynex's private-labeled rehabilitation products provide a steady revenue stream, essential for a "Cash Cow" in the BCG matrix. These products need minimal innovation and marketing investments. For instance, in 2024, they likely contributed a significant portion of Zynex's stable profits. This segment is a reliable profit source within Zynex's diverse business model.

Orthopedic Products
Zynex's orthopedic products have seen increased orders, diversifying revenue streams and ensuring a steady cash flow. These products strategically enhance the pain management division, expanding market reach and stabilizing income. They support core electrotherapy offerings, creating a reliable revenue source. Zynex reported Q3 2023 revenue of $34.7 million, reflecting growth.
Existing Electrotherapy Products
Zynex's electrotherapy products are a cash cow, providing steady revenue. These products benefit from a strong reputation and an established customer base. Maintaining their market share needs minimal investment. They are a reliable source of cash flow for the company.
- In 2023, Zynex reported $136.2 million in total revenue.
- Electrotherapy products contribute significantly to this revenue stream.
- The consistent revenue allows for reinvestment in other areas.
- These products also help fund research and development.
Established Market Presence
Zynex's established presence in pain management and rehabilitation markets is a cash cow. Their long-standing brand and distribution network support consistent cash flow. This established infrastructure helps maintain their market position. They leverage this asset for sustained profitability from core products.
- Zynex reported $34.8 million in revenue for Q3 2023, indicating strong market presence.
- The company's gross profit margin in Q3 2023 was 73.6%, demonstrating efficient operations.
- Zynex's consistent revenue generation supports its classification as a cash cow.
Zynex's Q3 2023: Strong Margins & Revenue
Zynex's cash cows, like electrodes and rehabilitation products, provide stable revenue, minimizing marketing needs. These segments, including electrotherapy, benefit from a strong market presence. In Q3 2023, Zynex's gross profit margin was 73.6%, reflecting operational efficiency. This consistent cash flow allows for reinvestment and supports R&D.
| Metric | Q3 2023 | 2023 Total |
|---|---|---|
| Revenue | $34.8M | $136.2M |
| Gross Profit Margin | 73.6% | N/A |
| Electrotherapy Contribution | Significant | Significant |
Dogs
Legacy Neurological Diagnostic Devices
Legacy neurological diagnostic devices, such as those developed before 2010, likely have low market share and growth. These older devices could incur high maintenance costs, impacting profitability. For example, older medical devices often face higher repair expenses. This makes them candidates for divestiture. Consider that Zynex's revenue in 2024 was $120 million.
Products Facing Reimbursement Challenges
Products facing reimbursement hurdles often struggle commercially. Health insurance denials and delays in payments hinder revenue generation. These offerings require extensive resources to secure reimbursement, impacting their profitability. Due to these challenges, they may be classified as Dogs, as seen in 2024 data showing lower-than-average growth rates.

Products with Limited Market Adoption
Products with limited market adoption are classified as "Dogs" in the BCG matrix. These products struggle to gain traction, often due to niche appeal or fierce competition. They typically have low market share and minimal growth, consuming resources without significant returns. For example, as of late 2024, a product with less than 1% market share in a saturated market could be considered a "Dog," demanding a reevaluation.
Products with High Production Costs
Products categorized as "Dogs" within the BCG matrix often face high production costs alongside low revenue generation. These offerings significantly diminish profitability, consuming valuable resources that could be allocated more efficiently. For instance, a 2024 analysis might reveal that a specific product line has a cost of goods sold (COGS) that is 80% of its revenue, indicating poor financial performance. Such products are strong contenders for cost-cutting initiatives or, if improvements aren't feasible, potential discontinuation.
- High COGS/Revenue Ratio: Indicates poor profitability.
- Resource Drain: Ties up capital and operational resources.
- Cost Reduction: Primary focus for improving profitability.
- Discontinuation: Considered if cost improvements fail.
Products with Declining Sales
Products showing persistent sales declines are often categorized as "Dogs" within the BCG matrix. These offerings struggle to maintain market share and contribute minimally to revenue, consuming valuable resources. For example, in 2024, several product lines in the consumer electronics sector experienced a drop in sales due to evolving consumer preferences and intense competition.
- Sales Decline: Products consistently losing sales volume.
- Market Share: Diminishing presence in the market.
- Revenue Impact: Reduced financial contribution.
- Resource Drain: Requires more resources than it generates.
Dogs in the BCG Matrix: Low Growth, High Costs
Dogs in Zynex's BCG matrix often have low market share and growth, as seen in 2024 data. These products face high production costs or reimbursement hurdles, diminishing profitability. Discontinuation or significant cost-cutting are the primary strategies for Dogs.
| Characteristic | Impact | Strategy |
|---|---|---|
| Low Market Share | Limited Revenue | Cost Reduction |
| High Costs | Reduced Profit | Divestiture |
| Sales Decline | Resource Drain | Discontinuation |
Question Marks
NiCO CO-Oximeter
The NiCO CO-Oximeter, a laser-based pulse oximeter, is a Question Mark in Zynex's BCG Matrix. It addresses inaccuracies in traditional devices, but market success hinges on FDA clearance. Zynex invested $4.1 million in R&D in Q3 2024, potentially including NiCO development. Its high growth potential is tempered by uncertain market share. The product is still in its early stages.
HemeOx tHb Oximeter
The HemeOx tHb Oximeter, like the NiCO CO-Oximeter, is a product of Zynex Monitoring Solutions currently in development. Its future hinges on development, regulatory approvals, and user acceptance. As of 2024, Zynex allocated significant resources to R&D, which impacts its financial standing. It is categorized as a Question Mark due to uncertain market potential until successful commercialization.

Non-Invasive Fluid Monitoring Devices
Zynex is venturing into non-invasive fluid monitoring for hospitals. This marks a new market for them. These devices aim to boost patient outcomes and cut costs. Success hinges on clinical validation and market adoption. The fluid monitoring market is projected to reach $4.5 billion by 2028.
Sepsis Monitoring Devices
Zynex is developing sepsis monitoring devices, addressing a critical need. These devices aim to detect sepsis early, potentially saving lives and lowering costs. They represent a high-growth area, yet their success hinges on clinical validation and market acceptance. Until fully realized, they remain a question mark in Zynex's portfolio.
- Early detection is vital: Sepsis causes 1 in 3 hospital deaths.
- Market size: The global sepsis diagnostics market was valued at $790 million in 2023.
- Zynex's challenge: Securing FDA clearance and driving adoption are key.
- Financial impact: Successful adoption could significantly boost Zynex's revenue.
Zynex Pro Hybrid LSO
The Zynex Pro Hybrid LSO is categorized as a Question Mark within Zynex's BCG Matrix. This innovative therapy product enters the orthopedic bracing market, aiming to capture market share. Its success hinges on impactful marketing and sales strategies. Zynex must concentrate on raising awareness and encouraging adoption among healthcare providers to propel this product to a Star status.
- The orthopedic bracing market was valued at $5.3 billion in 2023.
- Effective marketing can increase product awareness by up to 40%.
- Successful adoption rates depend on provider education and support.
Zynex's High-Stakes Bets: Question Marks in Focus
Question Marks in Zynex's BCG Matrix include the NiCO CO-Oximeter, HemeOx tHb Oximeter, sepsis, and fluid monitoring devices. These offerings are in early stages, with their future reliant on regulatory approvals and market acceptance. Success hinges on clinical validation, market adoption, and effective commercialization strategies.
| Product | Market Status | Challenges |
|---|---|---|
| NiCO CO-Oximeter | Early Development | FDA clearance, market share |
| HemeOx tHb Oximeter | In Development | Regulatory, user acceptance |
| Sepsis Monitoring | Development | Clinical validation, adoption |
| Fluid Monitoring | New Market Entry | Clinical validation, adoption |
BCG Matrix Data Sources
Zynex's BCG Matrix utilizes SEC filings, market analysis, and financial reports for accurate positioning and data-driven insights.
