Ampol Boston Consulting Group Matrix
Fully Editable
Tailor To Your Needs In Excel Or Sheets
Professional Design
Trusted, Industry-Standard Templates
Pre-Built
For Quick And Efficient Use
No Expertise Is Needed
Easy To Follow
Ampol Bundle
What is included in the product
Ampol's portfolio analyzed through the BCG Matrix. Focuses on strategic decisions: invest, hold, or divest.
Export-ready design for quick drag-and-drop into PowerPoint.
What You See Is What You Get
Ampol BCG Matrix
The Ampol BCG Matrix preview is the final report you'll receive. It's a fully functional, ready-to-use strategic tool. No extra steps or alterations required—just immediate access.

BCG Matrix Template
See the Bigger Picture
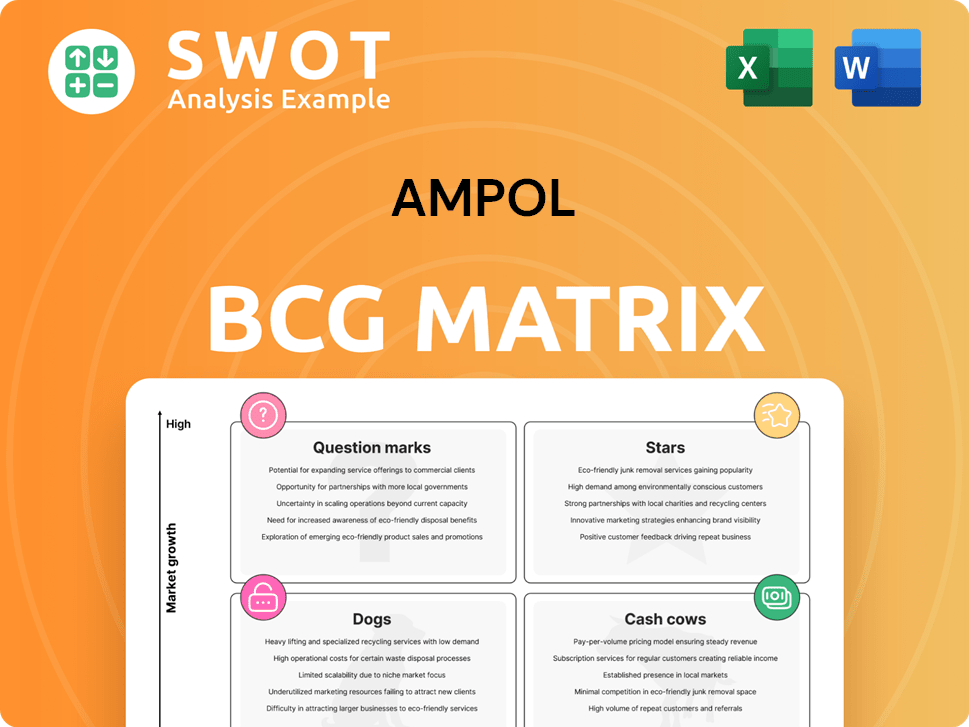
Ampol's BCG Matrix offers a snapshot of its diverse portfolio. This framework categorizes products based on market share and growth rate. Identify Stars, Cash Cows, Dogs, and Question Marks within their offerings. Understand Ampol's strategic strengths and weaknesses in the competitive landscape. This preview is just the beginning. Get the full BCG Matrix report to uncover detailed quadrant placements, data-backed recommendations, and a roadmap to smart investment and product decisions.
Stars
Convenience Retail Growth
Ampol's Convenience Retail segment shines as a Star. It demonstrated consistent earnings growth, with an EBIT of $356.6 million in FY24. Premium positioning and promotions fuel this success. Investments in network upgrades and restaurant partnerships fortify its strong market position.
Z Energy Performance
Z Energy, Ampol's New Zealand segment, has shown robust performance, bolstering overall earnings. Improved segmentation helped maintain a strong market position. Ampol's fuel supply operations add significant value. In 2024, Z Energy's contribution remains vital. It's a key part of Ampol's strategic outlook.

Premium Fuel Sales
Ampol's premium fuel strategy is paying off. The premium fuel mix rose from 53.7% in 2023 to 55.4% in 2024. This shift boosts margins even with lower overall fuel sales. It supports Ampol's 'Star' position in the market.
Electric Vehicle (EV) Charging Network Expansion
Ampol is aggressively expanding its AmpCharge EV charging network to stay ahead in the changing energy sector. By late 2024, the company had established 144 charging bays across 59 locations in Australia, showcasing its commitment. This includes strategic partnerships with third-party sites, such as Mirvac Shopping Centres, to increase accessibility. This expansion is a clear move to capitalize on the growing EV market.
- 144 charging bays at 59 sites delivered by December 2024.
- Partnerships with Mirvac Shopping Centres for EV charging.
- Ampol is adapting to the changing energy landscape.
Strategic Asset Base
Ampol's "Stars" status in the BCG Matrix highlights its strong strategic asset base. Ampol's competitive edge is driven by unmatched strengths in Australia and New Zealand's transport fuels sectors. This includes a robust infrastructure and integrated supply chain, crucial for meeting customer needs. Ampol reported a net profit after tax of $680.9 million in the first half of 2024. This demonstrates the company's financial health.
- Strategic assets include infrastructure and supply chain.
- Ampol's competitive advantages are unmatched.
- Net profit after tax in H1 2024 was $680.9 million.
- The company's supply chain is integrated.
High-Growth Segments Fueling Stellar Financials
Ampol's "Stars" are segments with high growth and market share. The Convenience Retail segment, a Star, achieved a FY24 EBIT of $356.6M. Z Energy in New Zealand also shines. Premium fuel sales rose to 55.4% in 2024, boosting margins.
| Segment | FY24 EBIT | Strategic Position |
|---|---|---|
| Convenience Retail | $356.6M | Star |
| Z Energy | Robust performance | Star |
| Premium Fuel Mix | 55.4% of Sales | Margin Booster |
Cash Cows
Fuel and Infrastructure Australia (Ex-Lytton)
The Fuels and Infrastructure Australia (ex-Lytton) segment is a cash cow, demonstrating consistent profitability. In 2024, this segment generated $251.6 million in earnings. Its steady performance provides reliable cash flow for Ampol. This supports other ventures and ensures financial stability.
Commercial Fuels Business
Ampol's Australian commercial fuels business is a cash cow, demonstrating its resilience. Premium fuel mix increased, boosting average fuel margins. Despite a 3.5% drop in fuel volumes in 2024, the focus on higher-margin grades remains. For example, in 2024, Ampol's convenience retail delivered a 21.1% increase in earnings before interest and tax (EBIT).

Strong Retail Network
Ampol's vast retail network, including over 2,000 service stations, is a key revenue driver. In 2024, this network generated significant income, with a focus on operational efficiency. Disciplined cost management boosts profitability, as seen in recent financial reports. This strong presence makes Ampol a reliable cash generator.
Loyalty Programs and Value Offers
Ampol's dedication to loyalty programs and value-driven offers is key to keeping customers engaged and boosting sales. Programs such as 'Crave 'N Save' and app-based deals attract budget-minded customers, encouraging them to keep coming back. This customer retention is vital for Ampol's cash cow status. In 2024, Ampol reported a significant increase in customer engagement through its loyalty programs.
- Ampol's loyalty program saw a 15% rise in active users in 2024.
- 'Crave 'N Save' promotions contributed to a 10% increase in food and beverage sales.
- App-based exclusive deals boosted fuel sales by 7% in the same year.
- Customer retention rates improved by 8% due to these value offers.
International Fuels and Infrastructure
Ampol's international fuels and infrastructure (F&I) segment, a cash cow in its BCG Matrix, generates consistent cash flow despite market fluctuations. This segment offers diversification, supporting the supply chain, even with limited value-creating opportunities. F&I's stability is reflected in its contribution to Ampol's overall financial health. In 2024, Ampol reported a solid performance, with F&I contributing to the company's resilient financial position.
- Provides diversification and supports the broader supply chain.
- Generates consistent cash flow.
- Subject to market volatility.
- Contributes to Ampol's overall financial health.
Fuel & Infrastructure: A Profitable Australian Story
Cash cows like Fuels and Infrastructure Australia consistently bring in profit. The Australian commercial fuels business is very resilient and efficient. Ampol's large retail network helps generate substantial income.
| Segment | Key Feature | 2024 Performance |
|---|---|---|
| Fuels & Infrastructure Australia | Consistent Profitability | $251.6M in earnings |
| Australian Commercial Fuels | Focus on High-Margin Fuels | 21.1% EBIT increase (convenience retail) |
| Retail Network | Operational Efficiency | Over 2,000 Service Stations |
Dogs
Tobacco Sales
Tobacco sales face a decline, partly due to illegal markets, affecting Ampol's convenience retail. Ampol has reduced its tobacco exposure, but shop sales are still affected. In 2024, tobacco sales experienced a 5% decrease. Mitigating this decline through diversification is key.
Lytton Refinery (During Downtime)
During downtime like the Q3 2024 Reformer Turnaround at Lytton, it's a Dog. Production and profits suffer, impacting its BCG Matrix status. The Lytton Refiner Margin (LRM) fell to US$1.48/barrel. This was an 83% drop from the prior quarter, reflecting the challenges.

Base Grade Fuel Volumes
Ampol faces a challenge with declining base grade fuel volumes as price-conscious customers opt for cheaper options. This shift impacts overall revenue, despite increased premium fuel sales. In 2024, base grade volumes decreased, reflecting changing consumer behavior. Addressing this requires customer retention and optimized pricing strategies. The decline in base grade volumes directly affects Ampol's financial performance.
International Sales Volumes (Certain Periods)
Ampol's international segment faces challenges, with fuel sales volumes decreasing in certain periods. The international segment witnessed a 9.5% decline in fuel sales volumes in Q3 2024, indicating market pressures. These declines stem from well-supplied markets, restricting sales opportunities. Diversification and strategic partnerships are crucial for navigating these obstacles.
- Q3 2024: 9.5% decline in fuel sales volumes.
- Market conditions: Well-supplied markets limit sales.
- Strategy: Focus on diversification and partnerships.
Energy Solutions (Early Stages)
Ampol's Energy Solutions division, focusing on EV charging, is in its early stages, potentially categorizing it as a Dog in the BCG Matrix. This segment's RCOP EBIT was a loss of ($24.4) million in the first half of 2024, indicating limited current returns. The transition from Dog requires strategic investments and partnerships to drive future growth. Success hinges on converting this segment into a Star or Cash Cow.
- Early-stage development.
- ($24.4) million RCOP EBIT loss (H1 2024).
- Requires investment and partnerships.
- Aiming for Star or Cash Cow status.
Underperforming Areas: A Look at the Challenges
Dogs represent struggling areas in Ampol's portfolio, often with low market share and growth. The Lytton refinery's Q3 2024 downtime, with LRM dropping to US$1.48/barrel, is a prime example. The Energy Solutions division, with a H1 2024 RCOP EBIT loss of ($24.4) million, also fits this category. These segments require strategic adjustments to improve their position.
| Dog Segment | Key Issue | Financial Impact (2024) |
|---|---|---|
| Lytton Refinery | Downtime, margin decline | LRM at US$1.48/barrel (Q3) |
| Energy Solutions | Early stage, low returns | ($24.4)M RCOP EBIT loss (H1) |
| Base Grade Fuel | Volume decrease | Sales impacted |
Question Marks
Sustainable Aviation Fuel (SAF) Production
Ampol's SAF initiatives are a Question Mark due to the early market stage and demand uncertainties. The Brisbane facility feasibility study with GrainCorp and IFM highlights their commitment. SAF production faces policy hurdles, critical for industry growth. The global SAF market was valued at $1.1 billion in 2023.
Renewable Diesel (RD) Production
Ampol's Renewable Diesel (RD) entry is a Question Mark. It faces evolving markets and regulations. The GrainCorp and IFM partnership is a positive move. Success hinges on government support, with RD production in Australia potentially reaching 350 million liters by 2025. The Australian government is aiming to increase biofuel use.

Green Hydrogen Fuelling Infrastructure
Ampol's green hydrogen plans are a Question Mark. Demand for hydrogen vehicles is uncertain. The CEFC invested $100M in sustainable initiatives. Partnerships and tech advancements are key. Ampol's 2024 revenue was $34.8B.
Ampol Energy (Home Electricity)
Ampol Energy's home electricity venture, initially a Question Mark, is now live in New South Wales, expanding beyond South-East Queensland. The energy market's competitiveness and customer acquisition challenges make this a risky area. Success hinges on regional expansion and offering unique services. In 2024, the Australian energy market saw significant price volatility.
- Ampol's move into home electricity is a relatively new strategy.
- Customer acquisition costs in the energy sector can be high.
- The market is competitive with numerous existing providers.
- Differentiating offerings is crucial for Ampol's success.
Energy Solutions (Aus)
Energy Solutions (Aus) within Ampol's BCG matrix likely represents a Question Mark due to its involvement in the nascent EV charging network. Ampol is strategically navigating the transition to electric vehicles, as evidenced by the AmpCharge rollout. This segment requires significant investment with uncertain returns, typical of Question Marks. The company must balance its traditional fuel business with this emerging EV infrastructure.
- Ampol is investing in the AmpCharge network, aiming for a significant presence in the EV charging market.
- The EV charging segment faces high initial costs and uncertain future profitability.
- Ampol's established fuel business provides the financial foundation.
- Success depends on the rapid adoption of EVs and efficient execution of the charging network rollout.
Future Fuels: Navigating Early-Stage Ventures
Ampol's "Question Mark" segments, like SAF and EV charging, are in early stages, facing market uncertainties. These ventures require substantial investment, such as the CEFC's $100M in sustainable initiatives, with outcomes yet to be fully realized. Success depends on effective market execution and favorable policy environments to drive growth, such as the Australian government's focus on biofuels.
| Segment | Investment Focus | Market Uncertainty |
|---|---|---|
| SAF | Feasibility studies, partnerships | Policy, demand |
| Renewable Diesel | Partnerships, production | Regulation, market |
| Green Hydrogen | Technology, partnerships | Vehicle demand |
BCG Matrix Data Sources
The Ampol BCG Matrix leverages market analysis, company filings, and industry publications to inform its strategic assessments.
