Apple Porter's Five Forces Analysis
Fully Editable
Tailor To Your Needs In Excel Or Sheets
Professional Design
Trusted, Industry-Standard Templates
Pre-Built
For Quick And Efficient Use
No Expertise Is Needed
Easy To Follow
Apple Bundle
What is included in the product
Apple's competitive environment is thoroughly examined, focusing on market forces like customer influence and market entry.
Understand market power immediately with a dynamic, color-coded visualization.
Full Version Awaits
Apple Porter's Five Forces Analysis
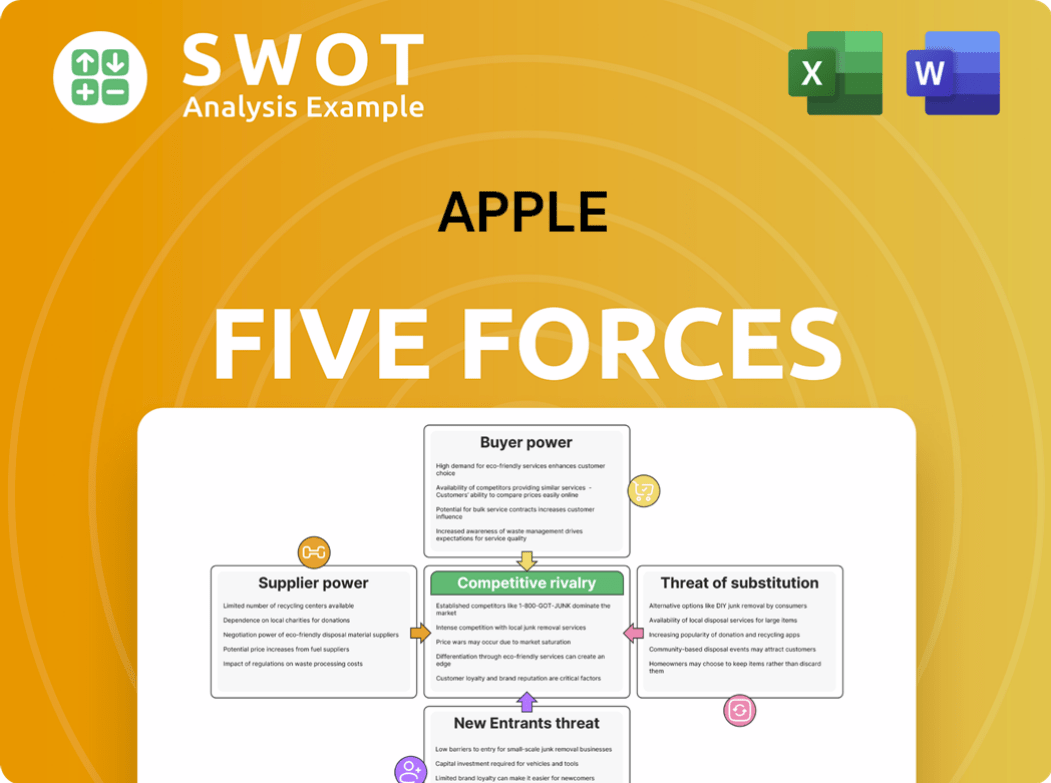
This preview details Apple's Porter's Five Forces analysis—identically what you'll download post-purchase. It covers competitive rivalry, supplier power, buyer power, threats of substitution, and new entrants. The comprehensive analysis includes key factors influencing Apple's market position. All the analysis is already made and formatted for your needs. You're getting the full, ready-to-use document.

Porter's Five Forces Analysis Template
Go Beyond the Preview—Access the Full Strategic Report
Apple's industry landscape is shaped by the interplay of five key forces: competitive rivalry, supplier power, buyer power, the threat of substitutes, and the threat of new entrants. Competitive rivalry is intense due to the presence of formidable tech giants like Samsung and Google. Supplier power is moderate, as Apple relies on a diverse range of component suppliers. Buyer power is significant, influenced by consumer choice and brand loyalty. The threat of substitutes is high, with Android devices and other tech products posing a challenge. New entrants face high barriers, including brand recognition and vast capital.
This brief snapshot only scratches the surface. Unlock the full Porter's Five Forces Analysis to explore Apple’s competitive dynamics, market pressures, and strategic advantages in detail.
Suppliers Bargaining Power
Supplier numbers
Apple's vast network of suppliers significantly diminishes the bargaining power of each. With numerous suppliers, Apple has substantial negotiating leverage. This ensures a consistent supply chain. In 2024, Apple sourced components from over 200 suppliers. This diverse base reduces reliance on any single entity.
Component standardization
Apple's component standardization reduces supplier bargaining power. This approach allows for easier supplier switching. In 2024, Apple's gross margin was approximately 43%. This strategy supports competitive pricing and stable supply chains. It ensures Apple's cost-effectiveness.

Large order size
Apple's substantial order volumes significantly influence supplier dynamics. Suppliers actively compete for Apple's sizable contracts, a key factor in their bargaining power. Apple's substantial purchasing power allows it to negotiate favorable terms. In 2024, Apple's global procurement spending exceeded $200 billion, highlighting its influence.
In-house chip design
Apple's in-house chip design significantly impacts its bargaining power with suppliers. Apple designs its own chips, but outsources manufacturing. This strategy reduces Apple's reliance on individual suppliers. It provides greater control over product specifications and innovation.
Apple's ability to design its chips reduces its dependency on suppliers like Intel or Qualcomm. This control allows for cost management and product differentiation. It supports Apple's ability to negotiate more favorable terms with its suppliers.
- Apple's R&D spending in 2024 was approximately $30 billion, reflecting its investment in chip design.
- Apple's gross margin in 2024 was around 45%, indicating a strong ability to manage costs.
- Apple's market capitalization in late 2024 exceeded $3 trillion, highlighting its financial strength.
Diversified supply chain
Apple's strategy involves a diversified supply chain, spreading its manufacturing and component sourcing across various countries. This approach helps reduce dependency on any single region, like China. In 2024, Apple continued to expand its manufacturing footprint outside of China, with significant investments in India and Vietnam. This diversification strategy helps Apple to navigate geopolitical risks and supply chain disruptions more effectively.
- Geographic diversification: Apple's supply chain spans multiple continents.
- Risk mitigation: Reduces vulnerability to regional instability.
- Operational resilience: Ensures production continuity during disruptions.
- Strategic investments: Ongoing expansion in new manufacturing hubs.
Apple's Supply Chain Dominance: A Deep Dive
Apple's diverse supplier network diminishes supplier bargaining power. Standardization and large order volumes further strengthen Apple's position. Apple's in-house chip design enhances its control over the supply chain.
| Aspect | Impact | 2024 Data |
|---|---|---|
| Supplier Diversity | Reduces supplier leverage | 200+ suppliers |
| Gross Margin | Cost control & pricing | ~45% |
| Procurement Spending | Negotiating power | >$200B |
Customers Bargaining Power
High brand loyalty
Apple benefits from high brand loyalty, with customers often choosing its products over competitors. This loyalty allows Apple to command premium prices, as seen in the iPhone's consistent market value. The iPhone 15 Pro Max, for example, starts at $1,199. This strong customer preference reduces their bargaining power, helping Apple sustain healthy profit margins. In 2024, Apple's gross margin was approximately 45%.
Premium product perception
Apple's premium image significantly shapes customer behavior. Their products, seen as top-tier, make customers less sensitive to price changes. In 2024, Apple's gross margin was around 45%, reflecting this pricing power. Consumers are happy to spend more for the perceived value and prestige. This strong brand perception is key.

Ecosystem lock-in
Apple's ecosystem creates a strong lock-in effect for its customers. Users are deeply invested in Apple's software and services, from the App Store to iCloud. The seamless integration across devices, like iPhones, iPads, and Macs, makes it less appealing to switch to competitors. In 2024, Apple's services revenue reached $85.2 billion, highlighting customer reliance. This lock-in reduces customer bargaining power.
Large customer base
Apple boasts a massive global customer base. The impact of losing a single customer is negligible for Apple. This broad and diverse customer base significantly diminishes the bargaining power of individual buyers, making it harder for them to influence Apple's pricing or product offerings. For instance, Apple's revenue in 2024 reached $383.3 billion. This immense scale gives Apple considerable control over its market position.
- Apple's global customer base is vast.
- Individual customer loss has little effect.
- Large base reduces buyer power.
- 2024 revenue was $383.3B.
Low switching costs (collectively strong)
Apple's customers have considerable bargaining power due to low switching costs collectively. While individual users might face hurdles, the broader market has options. This collective ability to switch puts pressure on Apple to remain competitive. The presence of alternative products and ecosystems allows consumers to move if Apple's offerings don't meet their needs. In 2024, Apple's global market share in smartphones was approximately 20%, highlighting the competition.
- Competition from Samsung and other Android devices forces Apple to innovate and offer competitive pricing.
- The availability of services like Spotify and Netflix, which are accessible across various platforms, reduces the lock-in effect.
- Consumers can easily compare prices and features, increasing their bargaining power.
- Apple's ecosystem, while strong, isn't impenetrable, as users can choose to adopt different platforms for specific needs.
Apple's Customer Power: A Balancing Act
Apple's customer bargaining power is moderate. High brand loyalty and ecosystem lock-in limit this power, sustaining premium pricing. Switching costs, while present, aren't insurmountable. In 2024, competition, such as Samsung, influences Apple's strategies.
| Factor | Impact on Bargaining Power | 2024 Data |
|---|---|---|
| Brand Loyalty | Reduces Power | iPhone market share ~20% |
| Switching Costs | Increases Power | Android market share ~80% |
| Competition | Increases Power | Apple's revenue: $383.3B |
Rivalry Among Competitors
Intense competition
The consumer electronics market is intensely competitive. Apple battles strong rivals like Samsung and Google. These companies constantly innovate to gain market share. For instance, in 2024, Samsung's mobile revenue was about $50 billion. This rivalry forces Apple to innovate rapidly.
Product differentiation
Apple's product differentiation, centered on design and its ecosystem, faces challenges. Core functionalities often mirror competitors, intensifying rivalry. In 2024, Apple's R&D spending reached $29.9 billion, reflecting the need for constant innovation. This investment is crucial for maintaining a competitive edge against rivals like Samsung.

Aggressive innovation
Aggressive innovation defines the competitive landscape. Competitors like Samsung and Google heavily invest in research, development, and marketing. This intensifies the pressure on Apple to sustain high spending levels. In 2024, Apple's R&D expenses reached $30 billion, reflecting this. The rapid tech pace necessitates continuous investment to remain competitive.
Low switching costs
Low switching costs significantly impact Apple, as customers can readily shift to rivals. This ease of movement necessitates Apple's constant efforts to retain customers through innovation and competitive pricing. The ability of consumers to switch between devices and operating systems fuels intense rivalry within the tech industry. In 2024, Apple's market share in smartphones was approximately 27%, facing pressure from Android alternatives.
- Customer loyalty programs are crucial for retaining users.
- Apple invests heavily in brand differentiation.
- Competitive pricing strategies become essential.
- Continuous innovation is key to staying ahead.
Market saturation
Market saturation is intensifying competitive rivalry in the smartphone and consumer electronics sectors. With markets nearing capacity, acquiring new customers is increasingly challenging for companies like Apple. This shift demands a greater emphasis on retaining existing customers and leveraging ecosystem advantages. Apple's services revenue, which includes areas like the App Store and Apple Music, grew to $23.1 billion in Q1 2024, showing the importance of ecosystem stickiness for revenue.
- Saturation leads to intense competition for existing customers.
- Customer retention and ecosystem lock-in become crucial for growth.
- Apple's services revenue highlights the importance of ecosystem strategy.
- Focus on the user experience to maintain market share.
Tech Titans Clash: A Battle for Supremacy
Competitive rivalry is fierce in consumer electronics. Apple competes with Samsung and Google, constantly innovating. Market saturation intensifies competition, focusing on customer retention. The tech industry sees rapid changes, like Apple’s $30B R&D in 2024.
| Aspect | Impact | Example |
|---|---|---|
| Innovation Pace | High, continuous | Apple R&D ($30B in 2024) |
| Switching Costs | Low for consumers | Android alternatives |
| Market Saturation | Intensifies rivalry | Focus on retention |
SSubstitutes Threaten
Availability of substitutes
Apple faces the threat of substitutes, as various alternatives exist. Android phones and Windows PCs offer similar features. This competition pressures Apple to maintain its premium pricing strategy. In 2024, Android held over 70% of the global smartphone market. This demonstrates the significant availability of substitutes for Apple products.
Software solutions
Software solutions pose a threat to Apple. Cloud gaming and web-based tools diminish the need for Apple hardware. These alternatives offer cost-effective, cross-platform options. In 2024, the global cloud gaming market was valued at $3.5 billion, showcasing growing demand.

Wearable alternatives
Fitbit, Garmin, and traditional watches pose as substitutes for the Apple Watch. These competitors offer specialized features, like advanced fitness tracking or classic designs. The availability of these substitutes means Apple must innovate. In 2024, Garmin's revenue was approximately $3.3 billion, showcasing its market presence.
Brand perception
Brand perception significantly impacts Apple's market position, with consumers often favoring competitors for specific needs. Some opt for high-end watches over Apple Watches, showcasing a preference for traditional luxury. This divergence highlights how different brands cater to varied consumer priorities, creating substitution threats. For instance, the global smartwatch market saw Samsung holding a 19.8% share in Q3 2024, while Apple had 21.6%.
- Diverse consumer preferences drive substitution.
- High-end watches represent a direct alternative.
- Competitors like Samsung challenge Apple.
- Market share data underlines this competition.
Ecosystem alternatives
The threat of substitutes in Apple's ecosystem comes from competitors like Google and Microsoft. These tech giants offer their own integrated ecosystems, providing alternatives to Apple's products and services. This competition gives consumers viable choices, potentially reducing Apple's market dominance. For instance, in 2024, Android's global market share for mobile OS was around 70%, significantly impacting Apple.
- Google and Microsoft ecosystems pose a threat.
- Alternatives reduce Apple's ecosystem lock-in.
- Consumer choice is enhanced by these competitors.
- Android's market share is a key factor.
Alternatives Challenging Apple's Dominance
Substitutes like Android, Windows, and cloud services pressure Apple. These alternatives offer similar functions, affecting pricing and market share. In 2024, Android's dominant share and cloud gaming's growth, valued at $3.5 billion, highlight this. This competition forces Apple to innovate to stay competitive.
| Substitute | Market Share (2024) | Revenue/Value (2024) |
|---|---|---|
| Android (Mobile OS) | ~70% | N/A |
| Cloud Gaming | N/A | $3.5 billion |
| Garmin (Revenue) | N/A | $3.3 billion |
Entrants Threaten
High capital requirements
Entering the consumer electronics market demands substantial capital. This high upfront investment deters new competitors. Extensive R&D, manufacturing, and distribution networks are costly. For instance, Apple's R&D spending in 2024 was over $30 billion. This financial burden significantly raises the bar.
Strong brand loyalty
Apple's strong brand loyalty poses a significant barrier to new entrants. Consumers are often reluctant to switch from their preferred brands, especially in tech. In 2024, Apple's brand value was estimated at over $300 billion. This loyalty requires substantial marketing and product differentiation. New entrants must invest heavily to compete.

Ecosystem lock-in
Apple's ecosystem, with its tight integration, poses a substantial barrier to new entrants. It's tough to replicate the seamless hardware, software, and services experience that Apple offers. In 2024, Apple's services revenue hit $85.2 billion, a testament to its strong ecosystem lock-in. New competitors struggle to match this integrated offering, making it difficult to compete effectively.
Economies of scale
Apple's massive scale provides substantial cost advantages, a key deterrent to new entrants. Production volumes are much higher, allowing Apple to negotiate better deals with suppliers and spread fixed costs across more units. New competitors face challenges matching Apple's prices due to their typically lower production volumes and consequently higher per-unit costs. In 2024, Apple's gross margin on products was around 35-40%, indicating strong cost control.
- High Production Volumes
- Supplier Negotiation Power
- Lower Per-Unit Costs
- Strong Gross Margins
Intellectual property
Apple's robust intellectual property (IP) defenses significantly reduce the threat of new entrants. The company's extensive portfolio of patents and trademarks protects its unique designs and cutting-edge technologies. This legal shield makes it incredibly difficult for competitors to replicate Apple's innovations, giving the company a considerable advantage. These protections are crucial in deterring new entrants from challenging Apple's market position.
- Apple holds over 60,000 active patents globally.
- In 2024, Apple spent over $29 billion on research and development, including IP protection.
- Apple's brand value, estimated at over $300 billion in 2024, is partly due to its strong IP.
- The cost of litigating IP infringement cases can reach millions, deterring smaller firms.
Apple's Fortress: Entry Barriers Examined
The threat of new entrants to Apple is moderate. High capital requirements, like Apple's $30B+ R&D spend in 2024, are a barrier. Brand loyalty and ecosystem lock-in, with 2024 services revenue at $85.2B, pose additional hurdles.
| Factor | Description | Impact |
|---|---|---|
| Capital Needs | High R&D, manufacturing, and distribution costs | Deters new entrants |
| Brand Loyalty | Strong customer preference for Apple | Difficult to compete |
| Ecosystem | Integrated hardware, software, and services | Competitive barrier |
Porter's Five Forces Analysis Data Sources
We utilized diverse sources including Apple's financials, industry reports, and competitor analyses to understand competitive dynamics. Regulatory filings and market share data further strengthened our findings.
