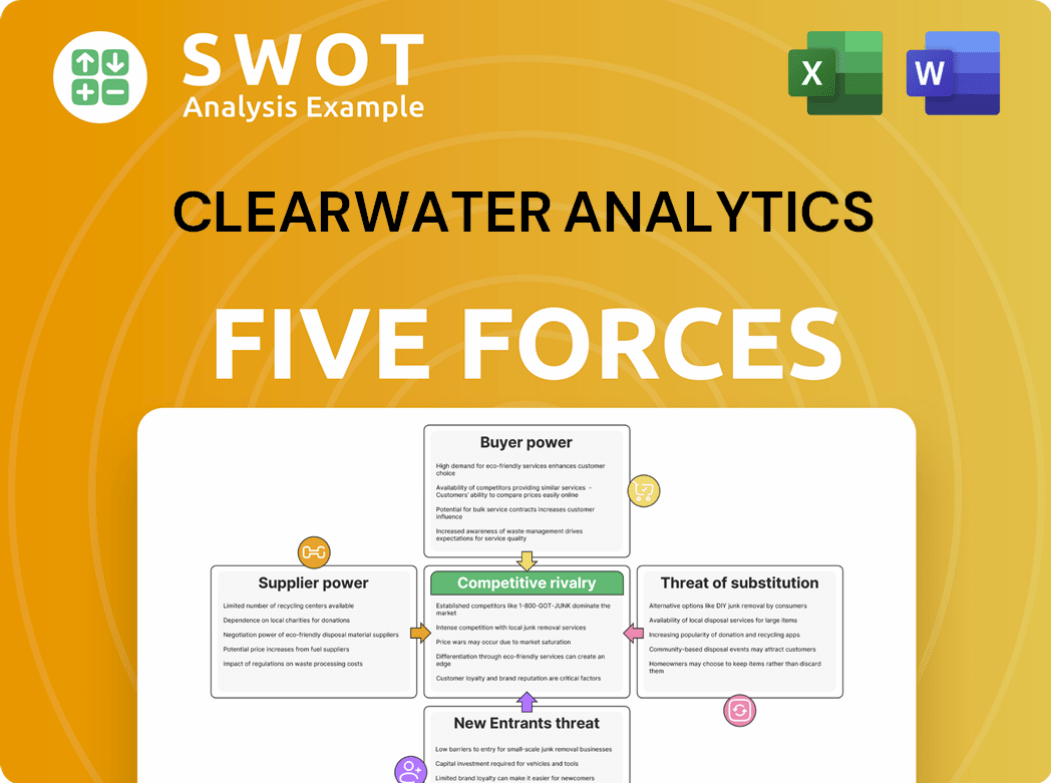
Clearwater Analytics Porter's Five Forces Analysis
Fully Editable
Tailor To Your Needs In Excel Or Sheets
Professional Design
Trusted, Industry-Standard Templates
Pre-Built
For Quick And Efficient Use
No Expertise Is Needed
Easy To Follow
Clearwater Analytics Bundle
What is included in the product
Evaluates control held by suppliers and buyers, and their influence on pricing and profitability.
A clear, one-sheet summary of all five forces—perfect for quick decision-making.
Preview Before You Purchase
Clearwater Analytics Porter's Five Forces Analysis
This is the complete Porter's Five Forces analysis for Clearwater Analytics. The preview you're seeing is the same comprehensive document that you'll receive immediately after purchase.

Porter's Five Forces Analysis Template
Elevate Your Analysis with the Complete Porter's Five Forces Analysis
Clearwater Analytics operates in a financial technology market shaped by specific forces. Buyer power, influenced by institutional clients, presents a key dynamic. The threat of new entrants, a factor to watch, is tempered by high barriers. Competitive rivalry with other FinTech providers is also intense.
Supplier power, particularly from data providers, and the potential for substitute solutions add further complexity. Understanding these forces is vital for assessing Clearwater’s strategic position. This preview is just the beginning. Dive into a complete, consultant-grade breakdown of Clearwater Analytics’s industry competitiveness—ready for immediate use.
Suppliers Bargaining Power
Limited number of key technology providers
Clearwater Analytics depends on external tech suppliers, like cloud infrastructure providers, for its SaaS platform. A limited number of these key providers could raise prices. This could impact Clearwater's costs and profitability. For example, cloud computing costs rose significantly in 2024.
Specialized data feeds are crucial
Clearwater Analytics relies heavily on specialized data feeds for its services. These feeds are essential for accurate investment accounting and reporting. Any increase in prices from these suppliers directly impacts Clearwater's operational costs.
If suppliers consolidate or raise prices, Clearwater's profitability could decrease. High supplier power can affect service quality, potentially leading to customer issues. In 2024, data feed costs for financial services firms increased by approximately 5-7%.

Talent pool for specialized skills
Clearwater Analytics relies heavily on specialized talent, including software developers and data scientists. The company's access to these skilled professionals directly impacts its operational costs. In 2024, the average salary for software developers in the US ranged from $70,000 to $150,000, increasing competition for talent. High labor costs can limit the company's ability to innovate efficiently.
Proprietary software components
Clearwater Analytics' reliance on proprietary software components significantly impacts supplier bargaining power. If Clearwater uses specific vendors, switching to alternatives becomes expensive and time-consuming. This dependence, or 'lock-in,' strengthens suppliers' leverage. For example, in 2024, the software market saw a 10% increase in vendor lock-in due to specialized solutions.
- Switching costs can be high, potentially 15-20% of the initial investment.
- Vendor-specific features often create barriers to switching.
- Integration challenges can extend project timelines by 6-12 months.
- Specialized software markets are often concentrated, with fewer viable suppliers.
Security infrastructure
Clearwater Analytics faces supplier bargaining power challenges, particularly in security infrastructure. The reliance on robust cybersecurity measures is critical. A constrained supply of trusted security vendors can inflate costs. The escalating demands for cybersecurity investments will strain capital allocation decisions. In 2024, cybersecurity spending is projected to reach $215 billion globally.
- Increasing Cybersecurity Threats: Clearwater needs strong security.
- Limited Vendors: Reliable security vendors are few, raising costs.
- Investment Pressure: Cybersecurity demands significantly influence capital allocation.
Supplier Power Dynamics: A Financial Services Challenge
Clearwater Analytics contends with supplier power, especially from tech and data providers. Rising costs from cloud infrastructure, data feeds, and talent directly affect its operational expenses and profit margins. Dependence on proprietary software and specialized vendors further strengthens supplier leverage, increasing switching costs and potentially limiting innovation. Cybersecurity demands also amplify these challenges, with projected global spending reaching $215 billion in 2024.
| Supplier Type | Impact | 2024 Data |
|---|---|---|
| Cloud Providers | Cost Increase | Cloud costs rose significantly |
| Data Feeds | Operational Costs | 5-7% increase in costs |
| Cybersecurity | Capital Allocation | Global spending: $215B |
Customers Bargaining Power
Switching costs are moderate
Clearwater Analytics' clients, though using an integrated SaaS solution, have moderate switching costs. Data migration, retraining, and system integration present challenges, creating leverage for negotiation. Competitors like BlackRock and SS&C offer alternatives, impacting pricing strategies. In 2024, the SaaS market showed varied pricing models, with some competitors offering flexible contracts.
Availability of alternative solutions
Customers wield significant bargaining power due to the availability of alternative solutions in the market. They can opt for in-house development, explore other Software-as-a-Service (SaaS) providers, or stick with traditional software vendors. This freedom to choose increases their leverage. For example, in 2024, the SaaS market grew, offering more options. This flexibility allows customers to negotiate terms or switch if Clearwater's offerings fall short.

Customer concentration
Customer concentration is a key factor in assessing Clearwater's bargaining power. If a few large clients generate most of Clearwater's revenue, they wield considerable influence. These clients, like major insurance firms and asset managers, can negotiate aggressively. For instance, in 2023, Clearwater's revenue reached $296.2 million, potentially making it vulnerable to key client demands.
Demand for personalized experiences
Clearwater Analytics' customers, especially in the B2B tech space, wield significant bargaining power. They often switch vendors if integration with their existing tech stack is poor [8][8]. This focus on personalized service directly impacts Clearwater Analytics' ability to retain and satisfy its client base.
- Integration issues are a primary driver for SaaS vendor changes.
- Personalized experiences are crucial for customer retention.
- SaaS companies that offer personalized support have lower churn rates.
SaaS subscription fatigue
Customer expectations are climbing, particularly in the SaaS sector, where buyers increasingly demand seamless onboarding and immediate support. SaaS firms that streamline these processes with better tools will likely gain customer loyalty in 2025 [1]. As SaaS subscription fatigue intensifies, users are scrutinizing ROI more closely, leading to increased price sensitivity. This shift empowers customers to negotiate better terms or switch providers more readily.
- In 2024, the SaaS market saw a churn rate of about 10-15% due to customer dissatisfaction [2].
- Companies with poor onboarding processes experience up to a 20% higher churn rate [3].
- Customer lifetime value (CLTV) is significantly impacted by these factors, with efficient onboarding increasing CLTV by up to 25% [4].
Customer Power Dynamics at a Glance
Clearwater Analytics faces moderate customer bargaining power due to available alternatives and market growth. Key clients' influence, like insurance firms and asset managers, enhances this power. Integration issues and personalized experiences strongly affect customer loyalty.
| Factor | Impact | 2024 Data |
|---|---|---|
| Market Alternatives | High | SaaS market grew, providing more options. |
| Customer Concentration | Moderate | Clearwater's 2023 revenue: $296.2 million. |
| Customer Expectations | High | SaaS churn rate: 10-15% due to dissatisfaction. |
Rivalry Among Competitors
Intense competition in SaaS market
The SaaS market for investment accounting and reporting is fiercely competitive. Numerous companies provide similar solutions, sparking price wars and feature enhancements. This drives up marketing costs as firms vie for market share. In 2024, the U.S. alone had over 17,000 SaaS companies, and a global customer base of 59 billion, generating $401.6 billion in revenue [14].
Differentiation through technology
Competitive rivalry intensifies as firms like Clearwater Analytics leverage AI and machine learning. Clearwater, in 2024, invested significantly in tech to enhance analytics and automation. This focus aims to offer unique value and stay ahead of competitors. This strategy is crucial in a market where technology is rapidly evolving.

Acquisitions and consolidation
The competitive landscape sees consolidation, with bigger firms buying smaller ones to boost offerings. Clearwater Analytics is expanding via acquisitions; for example, Enfusion was acquired [23, 24]. This strategy intensifies rivalry as firms vie for market share. The 2024 trend shows a push for broader service suites. Such moves increase the pressure on competitors to innovate and merge.
Focus on customer retention
In the competitive landscape, focusing on customer retention is critical. It's generally harder and more costly to retain customers than to find new ones, driving firms to prioritize retention efforts. Companies like Clearwater Analytics are concentrating on long-term customer value and operational efficiency to boost retention rates [1]. Net retention is a key metric, highlighting the importance of keeping existing clients [3].
- Customer retention boosts profitability.
- Focus on existing customer relationships.
- Operational efficiency is a must.
- Net retention is a key metric.
Geographic expansion
Geographic expansion is a key competitive battleground. Companies like Clearwater Analytics are aggressively moving into new markets to find more customers. Clearwater is boosting its presence in Asia-Pacific with new leadership [4]. International revenues were 18% of the total for 2024, but the potential market is huge at 46% [23].
- Clearwater Analytics is actively pursuing geographic expansion.
- Asia-Pacific is a major focus for growth.
- International revenue was 18% in 2024.
- International markets represent 46% of the total addressable market.
Investment Accounting SaaS Market Overview
Competition in investment accounting SaaS is high, with many firms vying for market share through tech and acquisitions. Clearwater Analytics invests in AI and expands geographically. The market saw 59 billion global customers in 2024.
| Metric | Data |
|---|---|
| 2024 SaaS Revenue | $401.6B USD |
| Clearwater's International Revenue (2024) | 18% |
| Total Addressable Market (International) | 46% |
SSubstitutes Threaten
Spreadsheet solutions
Some firms might lean on spreadsheets for investment accounting, a budget-friendly choice, particularly for smaller portfolios. However, these manual methods are often less efficient and can lead to errors. A 2024 study showed that manual processes increased data entry errors by up to 15%. This approach struggles with scalability compared to automated systems.
Traditional software
Traditional on-premise software presents a substitute for SaaS platforms like Clearwater Analytics. These solutions offer control over data and infrastructure. Yet, they demand substantial upfront investment and maintenance expenses. For instance, in 2024, the average initial cost for on-premise software implementation reached $150,000, plus $30,000 annually for maintenance, according to a report by Gartner.

Outsourcing
Outsourcing poses a threat to Clearwater Analytics. Companies can opt for third-party providers for investment accounting, potentially reducing costs. However, this shift may lead to diminished control over data and processes. The global outsourcing market reached $92.5 billion in 2024, signaling its prevalence. This makes outsourcing a viable substitute.
Emergence of niche SaaS products
The threat of niche SaaS products is increasing. These specialized software solutions, often developed by small teams, target specific needs. They can effectively serve a smaller customer base, potentially undercutting broader platforms. The trend indicates growing competition from these focused alternatives.
- Market research suggests a 15% annual growth in the niche SaaS market.
- Over 60% of SaaS startups focus on a specific industry or function.
- Funding for niche SaaS companies increased by 20% in 2024.
- Average customer acquisition cost (CAC) for niche SaaS is 30% lower than for broader platforms.
AI-driven personalization
The increasing availability of AI-driven personalization poses a threat to Clearwater Analytics. Vertical SaaS and micro SaaS solutions are gaining traction by offering highly tailored services. These solutions can potentially steal market share by providing more customized experiences. For instance, the global SaaS market is projected to reach $716.5 billion by 2028.
- AI-driven personalization enables tailored SaaS solutions.
- Vertical and micro SaaS offer specialized services.
- Customization can attract clients away from broader platforms.
- The SaaS market's growth indicates increasing competition.
Alternatives to the Financial Software: A Quick Look
Substitutes for Clearwater Analytics include spreadsheets, on-premise software, and outsourcing. Spreadsheets remain budget-friendly but are error-prone; manual data entry errors increased by up to 15% in 2024. Outsourcing and niche SaaS providers also offer alternatives, impacting the competitive landscape.
| Substitute | Description | 2024 Impact |
|---|---|---|
| Spreadsheets | Manual, cost-effective | Data entry errors up 15% |
| On-premise software | Traditional software | Implementation costs average $150,000 + $30k annually |
| Outsourcing | Third-party providers | Global market at $92.5B |
Entrants Threaten
High initial investment
High initial investment is a significant threat. Clearwater Analytics needed substantial capital for its SaaS platform. In 2024, SaaS companies' initial costs averaged $500,000 to $2 million [7]. This includes software development, infrastructure, and compliance.
Stringent regulatory requirements
Stringent regulatory requirements pose a significant threat. The investment management industry faces rigorous rules from bodies like the SEC, increasing barriers to entry [5][5]. New entrants must meet these standards, making market entry harder.

Brand reputation
Clearwater Analytics, with its established brand, benefits from customer trust and loyalty, a key barrier for new entrants. Building a comparable reputation requires significant investment in marketing and sales efforts. For example, marketing spend for FinTech firms in 2024 averaged 20-30% of revenue. Newcomers face the challenge of convincing clients to switch from a trusted provider.
Data security
Data security poses a significant threat to Clearwater Analytics. Protecting sensitive financial data demands substantial investments in robust encryption and security measures. The costs associated with these protections can be a barrier for new entrants. In 2024, the cybersecurity market is projected to reach $217.9 billion, reflecting the increasing importance of data security [7]. This reality intensifies the challenges for new competitors.
- High security costs can deter new firms.
- Compliance with data protection regulations is complex.
- Data breaches can damage reputation.
- Cybersecurity investments are ongoing.
AI and no-code tools
The rise of AI and no-code tools significantly lowers the barriers to entry for SaaS products. This trend is particularly evident in the financial sector, where new entrants can leverage these technologies to offer innovative solutions. This increased accessibility allows for rapid product development and deployment, intensifying competition. Consequently, established companies face a heightened threat from agile startups [1, 2, 3, 4].
- AI-powered tools streamline SaaS development, reducing costs.
- No-code platforms enable non-technical founders to launch products quickly.
- Increased competition can lead to price wars and market share battles.
- Established companies must innovate to maintain their competitive edge.
SaaS Startup Hurdles: Costs, Regulations, and Competition
The threat from new entrants is moderate, shaped by factors like capital needs and regulatory hurdles. SaaS startups face high initial costs; in 2024, these ranged from $500,000 to $2 million [7]. Stringent regulations demand expensive compliance, and building brand trust is a challenge.
AI and no-code tools lower barriers, intensifying competition. Companies must now innovate to maintain their competitive edge, with FinTech firms allocating 20-30% of revenue to marketing in 2024 [1, 2, 3, 4].
| Factor | Impact | Data Point (2024) |
|---|---|---|
| Initial Investment | High | $500,000 - $2M for SaaS [7] |
| Regulatory Compliance | Expensive | SEC's $2.4B budget [5] |
| Brand Trust | Established advantage | Marketing spend: 20-30% revenue |
Porter's Five Forces Analysis Data Sources
Clearwater Analytics' analysis leverages financial statements, market research, regulatory filings, and competitor information. This approach provides data for accurate assessment.
