Facebook Marketing Mix
Fully Editable
Tailor To Your Needs In Excel Or Sheets
Professional Design
Trusted, Industry-Standard Templates
Pre-Built
For Quick And Efficient Use
No Expertise Is Needed
Easy To Follow
Facebook Bundle
What is included in the product
An in-depth look at Facebook's 4Ps, providing a comprehensive analysis of its marketing tactics.
Streamlines Facebook marketing strategy for quick analysis and clear communication.
What You Preview Is What You Download
Facebook 4P's Marketing Mix Analysis
This Facebook 4Ps Marketing Mix analysis you're previewing is the exact, comprehensive document you'll download. It's the final, ready-to-use file.

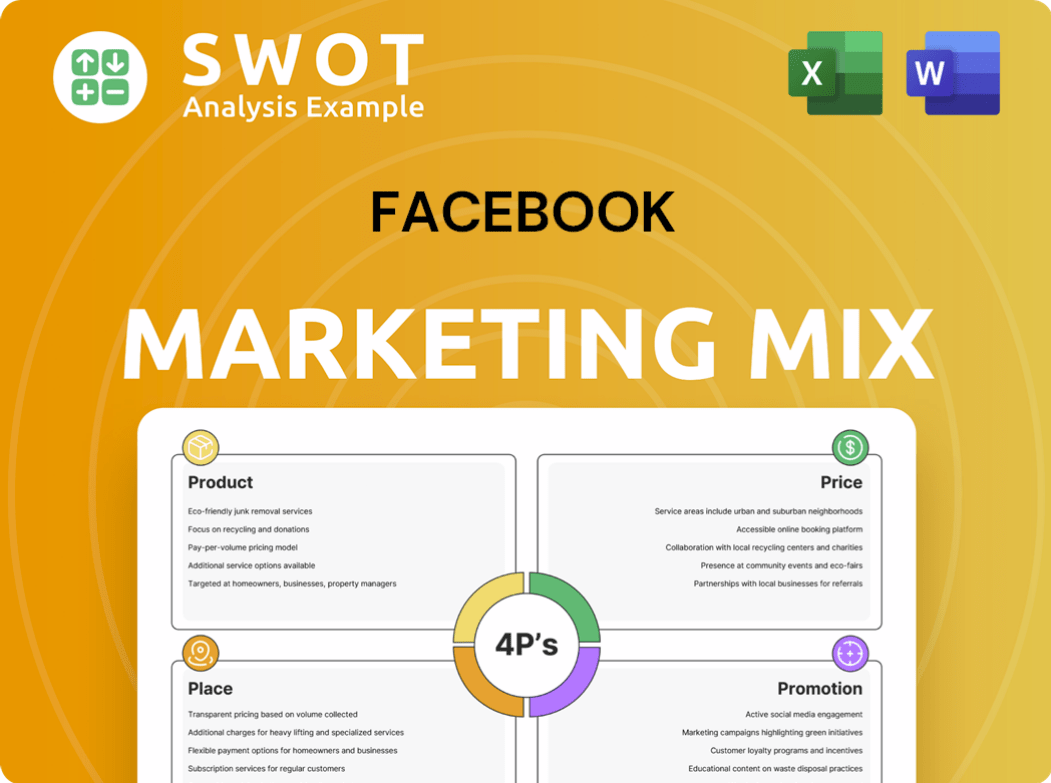
4P's Marketing Mix Analysis Template
Get Inspired by a Complete Brand Strategy
Discover how Facebook uses Product, Price, Place, and Promotion to dominate social media. This snippet explores its product features, from news feeds to marketplace. Learn about its freemium pricing and ad-based revenue. Explore its global distribution and massive user base. This overview is just the beginning; dive into Facebook's marketing tactics!
Go beyond the basics—get access to an in-depth, ready-made Marketing Mix Analysis covering Product, Price, Place, and Promotion strategies. Ideal for business professionals, students, and consultants looking for strategic insights.
Product
Social Networking Platforms
Facebook's social networking platforms, including Facebook, Instagram, and WhatsApp, are central to Meta's strategy. These platforms connect billions globally, facilitating content sharing and communication. Meta's primary focus is on user base growth to fuel its advertising revenue. In Q1 2024, Meta's ad revenue reached $36.5 billion, showing platform importance.
Advertising Services
Meta's advertising services are a core revenue driver, with 98% of Q1 2024 revenue from ads. These services offer diverse ad formats, crucial for reaching specific audiences. AI and advanced targeting, like Lookalike Audiences, boost ad performance. In Q1 2024, Meta's ad revenue reached $36.5 billion, up 27% YoY.

Messaging Services
Messenger and WhatsApp are core products in Meta's portfolio, offering instant messaging. As of Q1 2024, WhatsApp has over 2.7 billion monthly active users. These platforms are developing business messaging features. These features enhance direct customer communication and personalization.
Metaverse and Hardware
Meta's commitment to the metaverse involves significant investments in virtual reality hardware and software. This encompasses devices like the Meta Quest series and the Meta Horizon Store, a platform for VR applications. Although not a primary revenue source presently, this segment is pivotal to Meta's long-term strategy. In Q1 2024, Reality Labs, which includes VR, generated $440 million in revenue.
- Meta Quest 3 sales are projected to reach approximately 3.8 million units in 2024.
- The Meta Horizon Store offers a variety of VR experiences, with over 2,000 apps available as of late 2024.
Business Tools
Meta offers robust business tools like Meta Business Suite and Ads Manager. These tools streamline marketing, customer engagement, and advertising. Businesses can analyze performance through detailed analytics. In Q1 2024, Meta's advertising revenue reached $36.46 billion. These tools help businesses optimize their strategies.
- Meta Business Suite helps businesses manage their presence.
- Ads Manager facilitates running and managing ad campaigns.
- Analytics provide insights into campaign performance.
- Advertising revenue in Q1 2024 was $36.46B.
Advertising Revenue Soars: $36.46B in Q1 2024!
Facebook’s core products include social networking and messaging platforms. Instagram and WhatsApp are key components within this product portfolio. These products drive significant advertising revenue. In Q1 2024, advertising revenue hit $36.46B.
| Product | Description | Key Features |
|---|---|---|
| Social network | Newsfeed, Groups, Events | |
| Photo and video sharing | Stories, Reels, Shopping | |
| Messaging service | Text, voice, video calls |
Place
Global Digital Accessibility
Meta's global reach hinges on digital accessibility. Its platforms are used worldwide via the internet on devices like smartphones and PCs. This digital distribution is crucial for Meta, enabling it to connect with billions. In Q4 2024, Meta reported 3.19 billion daily active users across its family of apps.
Mobile-First Approach
Facebook's mobile-first approach prioritizes mobile user experience and ad delivery. In Q4 2023, mobile advertising revenue was $37.8 billion, showing its importance. This strategy ensures accessibility on smartphones and tablets. Mobile MAUs (monthly active users) reached 3.07 billion in Q4 2023, underscoring its success.

Integrated Platform Ecosystem
Meta's integrated platform ecosystem links Facebook, Instagram, Messenger, and WhatsApp, streamlining business operations. Businesses can manage ads across platforms, simplifying campaign oversight. In Q1 2024, Meta's ad revenue hit $36.5 billion, showing the ecosystem's effectiveness. This unified approach boosts efficiency and reach for advertisers.
App Stores and Web Browsers
Meta's applications are readily available through major app stores like Apple's App Store and Google Play. Web browsers facilitate access to desktop versions of platforms such as Facebook and Instagram. This dual-channel approach ensures accessibility for users regardless of device preference. In Q1 2024, Facebook's monthly active users (MAU) reached 3.09 billion, demonstrating broad reach.
- App stores and web browsers provide access.
- Multi-channel access enhances user availability.
- Facebook's MAU was 3.09 billion in Q1 2024.
Meta Horizon Store for VR
The Meta Horizon Store is a key distribution channel for Meta's VR products, offering apps and experiences for devices like Meta Quest. This focus supports the growth of the metaverse ecosystem. In Q1 2024, Meta's Reality Labs revenue was $440 million, with a loss of $3.85 billion. This shows ongoing investment in VR.
- Distribution: Primary channel for VR content.
- Ecosystem: Supports the metaverse's development.
- Financials: Reality Labs revenue and losses.
Facebook's Massive Reach: 3.09 Billion MAUs!
Facebook's place strategy centers on wide accessibility through app stores, web browsers, and mobile platforms. This multi-channel approach allows a massive global reach. Facebook's MAUs hit 3.09 billion in Q1 2024, reflecting strong distribution effectiveness. Reality Labs revenue was $440M in Q1 2024 with a $3.85B loss.
| Platform | Access Points | Key Metric (Q1 2024) |
|---|---|---|
| App Stores, Web Browsers | MAU: 3.09B | |
| VR (Meta Horizon) | Meta Quest Store | Reality Labs Revenue: $440M |
| Overall | Mobile & Digital | Ad Revenue: $36.5B (Q1 2024) |
Promotion
Targeted Digital Advertising
Meta's advertising platform is the core promotion tool. Businesses use it to target specific audiences. In Q1 2024, Meta's ad revenue was $36.46 billion. This strategy maximizes reach across Facebook and Instagram.
Content Marketing and Engagement
Content marketing on Facebook focuses on creating engaging content. Short-form videos like Reels and Stories are very popular. User interaction and sharing boosts visibility. In 2024, Instagram Reels' average engagement rate was 1.37%. This strategy effectively builds brand awareness.

Business Pages and Profiles
Creating business pages on Facebook and Instagram offers a free promotional avenue. Companies can share updates and engage directly with their audience. In 2024, over 2.9 billion people used Facebook monthly, boosting brand visibility. This direct interaction helps build relationships and brand loyalty. Businesses leverage these platforms for cost-effective marketing.
Integration with E-commerce
Meta's integration with e-commerce significantly boosts business promotion. Facebook Shops and Instagram Shopping allow direct product sales within the platforms, simplifying the buying process. This strategy is evident in the growth of social commerce, which is projected to reach $1.2 trillion globally by 2025.
- Direct purchasing options increase conversion rates.
- Businesses can leverage targeted advertising to reach potential customers.
- Meta provides tools for managing product catalogs and orders.
Leveraging AI for Ad Optimization
Meta actively pushes its AI-driven tools, highlighting their ability to enhance ad campaigns. These tools refine ad creative, targeting, and bidding strategies. This boosts campaign efficiency and ROI for businesses. In 2024, Meta's AI saw a 20% increase in ad performance for early adopters.
- Automated Creative Optimization: AI adjusts ad formats and content.
- Smart Targeting: AI finds the best audience for ads.
- Dynamic Bidding: AI sets optimal bids in real time.
- Improved ROI: Businesses see better returns on ad spend.
Boosting Sales: A Guide to Social Media Promotion
Facebook's promotion tools include ads, content, and business pages. Meta's Q1 2024 ad revenue hit $36.46B. Instagram Reels saw a 1.37% engagement rate in 2024. E-commerce integration aids direct sales.
| Promotion Element | Strategy | Impact |
|---|---|---|
| Advertising | Targeted ads on Facebook/Instagram | Maximizes reach |
| Content Marketing | Engaging content, Reels, Stories | Boosts brand awareness |
| Business Pages | Sharing updates, direct audience engagement | Cost-effective promotion |
Price
Advertising Revenue Model
Meta's main revenue stream comes from advertising, using an auction-based pricing model. Advertisers bid for ad space, with prices affected by targeting, competition, and ad quality. In Q1 2024, Meta's ad revenue reached $36.46 billion, up 27% year-over-year. This auction system allows them to maximize revenue from ad placements.
Dynamic Pricing for Ads
Meta's ad pricing is dynamic, changing with demand, audience worth, and campaign goals. This flexibility lets advertisers adjust budgets as needed. In Q4 2023, Meta's average revenue per user (ARPU) globally was $14.87, showing the value advertisers place on reaching users. This dynamic model helps optimize ad spend efficiently.

Subscription Options (in certain regions)
In specific areas, Meta now offers subscription choices due to regulatory demands, enabling ad-free usage for a fee. This strategy gives Meta a new income source beyond its main advertising model. As of Q1 2024, Meta's revenue reached $36.46 billion, showing adaptability. The subscription model could diversify and stabilize revenue, potentially enhancing long-term financial health.
Variable Cost Per Ad Impression/Click
Facebook's pricing model for ads hinges on variable costs, primarily determined by ad impressions or clicks. Advertisers bid on these metrics, influencing the cost per action. The average cost per click (CPC) on Facebook in 2024 ranged from $0.50 to $2.00, and cost per thousand impressions (CPM) was between $7.19 and $9.09, but this can fluctuate.
- CPC: $0.50 - $2.00 (2024 average)
- CPM: $7.19 - $9.09 (2024 average)
- Targeting and ad format affect pricing.
- Campaign objectives influence ad costs.
Pricing for Business Tools and Services
Meta's pricing strategy revolves around a "freemium" model. Basic use of Facebook, Instagram, and WhatsApp is free, attracting a vast user base. Businesses can access advanced analytics and features through paid tools. Advertising remains the primary revenue driver, with Meta's ad revenue reaching $134.9 billion in 2023.
- Free core platform access for users.
- Paid tools and services for businesses.
- Advertising is the main revenue stream.
- Meta's 2023 ad revenue: $134.9 billion.
Advertising Costs & Revenue: Key Metrics
Meta utilizes an auction-based, dynamic pricing model for advertising, key to its revenue. Prices fluctuate based on demand and user value; this dynamic adjusts budgets. Average CPC in 2024: $0.50-$2.00, CPM: $7.19-$9.09, impacting ad costs.
| Metric | Value | Notes |
|---|---|---|
| 2023 Ad Revenue | $134.9 billion | Main revenue source |
| Q1 2024 Ad Revenue | $36.46 billion | 27% YoY increase |
| 2024 Average CPC | $0.50 - $2.00 | Influenced by targeting |
| 2024 Average CPM | $7.19 - $9.09 | Affects ad spend |
| ARPU (Q4 2023) | $14.87 | Global value |
4P's Marketing Mix Analysis Data Sources
Our Facebook 4P's analysis leverages public company reports, advertising data, and platform analytics for a precise marketing mix review. We analyze pricing, promotions, distribution, and product information.
