O-I Glass Porter's Five Forces Analysis
Fully Editable
Tailor To Your Needs In Excel Or Sheets
Professional Design
Trusted, Industry-Standard Templates
Pre-Built
For Quick And Efficient Use
No Expertise Is Needed
Easy To Follow
O-I Glass Bundle
What is included in the product
Analyzes O-I Glass's position within the glass container market by evaluating competitive forces and potential threats.
Instantly visualize strategic pressures using an interactive spider/radar chart for quick analysis.
Same Document Delivered
O-I Glass Porter's Five Forces Analysis
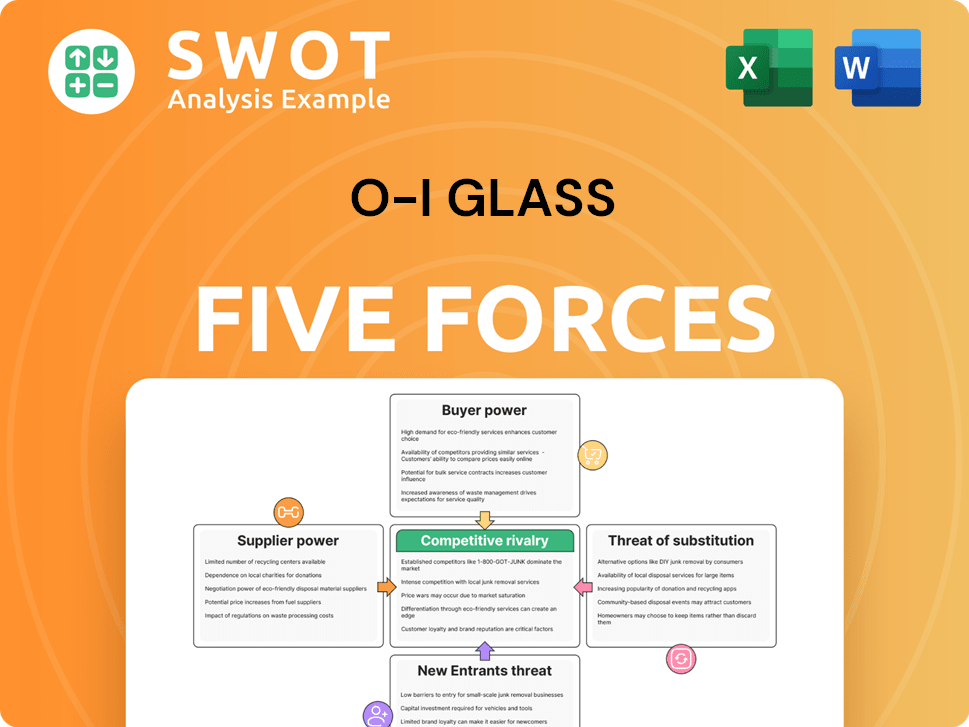
This preview showcases the complete O-I Glass Porter's Five Forces analysis. The analysis examines industry rivalry, supplier power, buyer power, threat of substitutes, and threat of new entrants. Each force is thoroughly assessed to provide a clear understanding of the competitive landscape. What you're previewing is what you get—professionally formatted and ready for your needs.

Porter's Five Forces Analysis Template
From Overview to Strategy Blueprint
O-I Glass faces a complex competitive landscape, with factors like supplier power and the threat of substitutes significantly impacting its strategic position. The company's ability to manage buyer power and navigate the competitive rivalry within the glass container industry is crucial for sustained success. Furthermore, understanding the threat of new entrants and external factors is key. A preliminary look at these forces only unveils a fraction of the full story.
Ready to move beyond the basics? Get a full strategic breakdown of O-I Glass’s market position, competitive intensity, and external threats—all in one powerful analysis.
Suppliers Bargaining Power
Supplier Concentration
O-I Glass sources crucial materials like silica sand and soda ash. High supplier concentration gives these entities pricing power. For example, a few soda ash suppliers could raise prices. This directly impacts O-I's production costs.
Switching Costs for O-I
Switching costs for O-I Glass are crucial in assessing supplier power. High switching costs, due to the expense and time needed to change suppliers, bolster supplier control. O-I's reliance on specialized suppliers for glass manufacturing equipment, for example, increases these costs. In 2024, O-I Glass spent $1.2 billion on raw materials and supplies, indicating the financial impact of supplier choices.

Supplier Forward Integration
Suppliers, like those providing raw materials, could integrate forward. This move would enable them to directly compete with O-I Glass. If suppliers have resources, this threat becomes more credible, increasing their power. Consider the potential for a major chemical company that provides key materials to start manufacturing glass containers. In 2024, raw material costs significantly impacted O-I's profitability, highlighting the supplier's influence.
Impact of Input on O-I's Product
O-I Glass's product quality heavily relies on the raw materials used. Suppliers gain power if their inputs significantly affect the final glass container quality. High-quality glass demands specific inputs, providing those suppliers with leverage. The unique characteristics of certain materials further enhance supplier bargaining power. For instance, in 2024, the cost of silica sand, a key input, could influence O-I's production costs.
- Supplier concentration can affect bargaining power.
- Raw material availability is crucial.
- The specificity of inputs impacts supplier power.
- O-I's ability to switch suppliers also matters.
Availability of Substitute Inputs
The availability of substitute inputs significantly influences supplier power in O-I Glass's market position. If O-I Glass can readily switch to alternative materials, suppliers' control diminishes. Conversely, limited substitutes empower suppliers to dictate prices and supply terms. For example, the cost of soda ash, a key raw material, impacts O-I Glass's production costs.
- Availability of alternative materials affects supplier power.
- Limited substitutes increase supplier's control.
- Soda ash cost impacts O-I Glass's production.
Supplier Dynamics Impacting Production Costs
O-I Glass faces supplier power from concentrated raw material providers like silica sand and soda ash, affecting production costs. High switching costs, notably for specialized equipment, enhance supplier control. Suppliers can also integrate forward, posing a direct competition threat. O-I Glass's reliance on specific, high-quality inputs further boosts supplier influence.
| Factor | Impact | 2024 Data (Approximate) |
|---|---|---|
| Supplier Concentration | High concentration increases pricing power | Soda ash market: top 3 suppliers control ~70% |
| Switching Costs | High costs reduce O-I's bargaining power | Raw materials and supplies spending ~$1.2B |
| Substitute Availability | Limited alternatives boost supplier influence | Specialty chemicals impact on glass quality |
Customers Bargaining Power
Buyer Volume
Large customers, like major beverage companies, wield significant bargaining power due to their high-volume orders. These customers can pressure O-I Glass for discounts and favorable terms. In 2024, O-I Glass's revenue was heavily influenced by key accounts, underscoring this dynamic. The company's dependence on these large buyers increases their influence.
Customer Price Sensitivity
Customer price sensitivity significantly impacts O-I Glass's profitability. When customers are highly price-sensitive, they can push for lower prices, especially if the products seem similar. For example, O-I Glass's net sales were approximately $6.9 billion in 2023. Alternative packaging options, like plastic or aluminum, amplify this sensitivity.

Switching Costs for Buyers
The bargaining power of O-I Glass's customers is significantly influenced by switching costs. Low switching costs empower buyers to readily switch between suppliers. For example, in 2024, the global market share for glass packaging was around 25%, with the rest split between alternatives. Customers can switch to plastic or aluminum packaging without major disruptions. This ease of switching increases the pressure on O-I to offer competitive pricing and terms.
Buyer Information Availability
Customers with ample information on market prices and supplier choices hold significant power. This transparency allows buyers to negotiate better terms, thus increasing their leverage. For example, in 2024, the rise of online platforms has made it easier for buyers to compare prices and product specifications. This empowers customers in negotiations, potentially driving down prices.
- Online price comparison tools enhance buyer power.
- Increased market transparency favors informed customers.
- Access to data strengthens negotiation positions.
- Customers leverage information for favorable terms.
Customer Backward Integration
Customers of O-I Glass, such as beverage or food companies, could gain bargaining power by threatening to produce their own glass containers through backward integration. This threat is most credible if the customer possesses the financial and technical resources to enter the packaging industry. For instance, in 2024, the packaging industry saw significant consolidation, with major players like Ball Corporation and Ardagh Group expanding their operations. This consolidation could increase the bargaining power of large customers who can negotiate better terms or even consider self-supply. The more feasible self-supply is, the greater the buyer's leverage.
- 2024 saw a global glass container market valued at approximately $60 billion.
- Large beverage companies like Coca-Cola and PepsiCo have substantial resources to explore self-manufacturing.
- The cost of setting up a glass manufacturing plant can range from $100 million to $500 million.
- Technological advancements have made glass manufacturing more accessible, but still require specialized expertise.
Customer Power Dynamics: A Glass Industry Overview
O-I Glass faces significant customer bargaining power, particularly from large beverage companies capable of demanding favorable terms and discounts. Price sensitivity is heightened by alternative packaging options like plastic, which are readily available, pressuring prices. Transparent markets and easy access to information further empower customers to negotiate effectively.
| Aspect | Impact | 2024 Data |
|---|---|---|
| Customer Size | High-volume buyers leverage purchasing power | Top 10 customers account for ~30% of revenue |
| Price Sensitivity | Alternatives like plastic increase price competition | Plastic packaging market share ~40% of total market |
| Switching Costs | Low switching costs increase customer options | Average switching cost to alternative packaging ~2% |
Rivalry Among Competitors
Number of Competitors
The glass container industry features numerous competitors, intensifying rivalry. This high competition can trigger price wars, squeezing profit margins. O-I Glass contends with global giants and regional firms. In 2024, the top five players controlled about 60% of the market share, indicating moderate concentration.
Industry Growth Rate
Slow industry growth often makes competition fiercer, as companies strive for the same market share. In 2024, the global glass container market's growth was modest, around 2-3%. This environment requires O-I Glass to compete vigorously to hold or grow sales. Stagnant growth can trigger price wars; in 2024, O-I Glass faced margin pressures.

Product Differentiation
Low product differentiation intensifies competitive rivalry. If glass containers are perceived as commodities, price becomes the primary battleground. O-I Glass strives to stand out through innovation, emphasizing sustainability and superior customer service. In 2024, O-I Glass reported a revenue of $6.9 billion, highlighting its market position.
Exit Barriers
High exit barriers intensify rivalry by keeping struggling companies in the market. Specialized assets, like O-I Glass's unique furnace technology, make it hard to leave. Contractual obligations and emotional ties also delay exits, contributing to overcapacity and price wars. These barriers directly impact profitability and market stability, as seen in the glass industry. For example, in 2024, O-I Glass faced challenges due to oversupply.
- Specialized Assets: O-I Glass's furnace technology.
- Contractual Obligations: Long-term supply deals.
- Emotional Attachment: Brand legacy.
- Market Impact: Overcapacity and price pressure.
Concentration Ratio
The concentration ratio is a key indicator of competitive rivalry. A higher concentration ratio, where a few firms control most of the market, can lead to less intense competition. Conversely, a lower ratio, with many firms sharing the market, often results in fiercer rivalry. O-I Glass faces competition influenced by its market share compared to rivals.
- In 2024, O-I Glass's market share was approximately 20-25% globally.
- Ball Corporation holds a significant market share, estimated around 15-20% in 2024.
- Berry Global Group also competes, with a market share of about 10-15% in 2024.
- These figures reflect a moderately concentrated market, influencing competitive dynamics.
Glass Container Market: Intense Competition
Competitive rivalry in the glass container industry is intense, with numerous global and regional competitors. In 2024, market concentration was moderate, with the top five players controlling about 60% of the market share. O-I Glass faces pressure to compete due to slow industry growth and low product differentiation.
High exit barriers, such as specialized assets like O-I Glass's furnace technology, exacerbate rivalry. The market's dynamics are influenced by O-I Glass's market share against key rivals like Ball Corporation and Berry Global Group.
For 2024, O-I Glass's revenue was $6.9 billion.
| Company | Market Share (2024) | Revenue (2024) |
|---|---|---|
| O-I Glass | 20-25% | $6.9B |
| Ball Corporation | 15-20% | N/A |
| Berry Global Group | 10-15% | N/A |
SSubstitutes Threaten
Availability of Substitutes
The availability of substitutes significantly impacts O-I Glass. Plastic, aluminum, and paperboard offer alternative packaging solutions. In 2024, the global packaging market was valued at approximately $1.1 trillion. Recycled PET (rPET) bottles are also a growing challenge, with the rPET market expected to reach $10.5 billion by 2025.
Relative Price Performance
The threat of substitutes for O-I Glass hinges on relative price performance. If alternatives like plastic offer a better cost-benefit, the risk rises. In 2024, plastic packaging's lower cost and lighter weight were attractive to buyers. O-I Glass must emphasize glass's value through sustainability and brand image to compete. For example, in 2024, the global plastic packaging market was valued at approximately $300 billion.

Switching Costs to Substitutes
Low switching costs to alternative packaging significantly amplify the threat of substitutes for O-I Glass. Beverage companies can readily shift from glass bottles to aluminum cans or plastic, increasing competitive pressure. In 2024, aluminum can production is projected to grow by 3.5%, reflecting this trend. The ease of integrating new packaging technologies further influences this dynamic; for instance, the global market for sustainable packaging reached $350 billion in 2023, highlighting the shift.
Buyer Propensity to Substitute
The threat of substitutes for O-I Glass hinges on buyer willingness to switch. If consumers readily opt for alternative packaging like plastic or aluminum, O-I Glass faces increased competition. Consumer preferences for sustainable packaging, a growing trend, also affect this threat. The market for sustainable packaging is expected to reach $300 billion by 2025.
- Demand for sustainable packaging is rising, impacting O-I Glass's market position.
- Plastic and aluminum are key substitutes, influencing buyer choices.
- Companies must innovate to meet evolving consumer preferences.
- O-I Glass needs to highlight the recyclability of glass.
Substitute Product Innovation
Substitute product innovation poses a notable threat to O-I Glass. Ongoing advancements in alternative materials, like plastics and aluminum, can enhance their appeal. Innovations in plastic recycling and the development of biodegradable packaging solutions are particularly concerning. Continuous improvement in these substitutes erodes glass's market position.
- Plastic packaging market was valued at $340.3 billion in 2023.
- The global aluminum packaging market was estimated at $34.5 billion in 2023.
- O-I Glass's revenue in 2023 was $6.9 billion.
- The market for biodegradable packaging is projected to reach $16.5 billion by 2028.
Packaging Rivals: Plastic, Aluminum & More
The threat of substitutes for O-I Glass is significant, primarily from plastic and aluminum. These alternatives offer different benefits and often cost less. The ease of switching between packaging types increases the competitive pressure on O-I Glass.
| Substitute | 2024 Market Value (approx.) | Key Consideration |
|---|---|---|
| Plastic Packaging | $300 billion | Lower cost, lightweight |
| Aluminum Packaging | $35 billion | Growth in demand |
| Sustainable Packaging | $350 billion (2023) | Consumer preference |
Entrants Threaten
Capital Requirements
The glass container industry demands substantial capital for new entrants, acting as a significant barrier. Building glass manufacturing plants involves considerable investment in specialized equipment and advanced technology, like the latest furnaces. For example, a new plant could cost hundreds of millions of dollars. This high capital requirement deters potential competitors.
Economies of Scale
O-I Glass, already established, enjoys significant economies of scale, lowering its production costs. New glass manufacturers find it tough to match O-I's efficiency, creating a cost barrier. O-I's established infrastructure and large-volume purchasing power give it a competitive edge. For example, in 2024, O-I Glass reported a cost of revenue of $5.5 billion.

Brand Loyalty
O-I Glass benefits from brand loyalty, a significant barrier for new competitors. Customers often stick with familiar brands, creating an advantage. Developing brand recognition requires substantial time and money, hindering newcomers. This loyalty translates into a competitive edge, as seen in the glass container market. In 2024, established brands held a majority of the market share, reflecting this dynamic.
Government Regulations
Stringent government regulations pose a significant threat by increasing barriers to entry for new competitors in the glass industry. Compliance with environmental and safety standards demands substantial investment and specialized expertise, making it difficult for newcomers to compete. These regulatory hurdles can effectively limit the number of potential entrants, thereby influencing the competitive landscape. For instance, in 2024, the Environmental Protection Agency (EPA) imposed stricter emission standards, increasing operational costs for all glass manufacturers.
- EPA's stricter emission standards implemented in 2024.
- Increased compliance costs for all glass manufacturers.
- Regulations requiring advanced pollution control technologies.
- Higher initial investments to meet safety protocols.
Access to Distribution Channels
New entrants face hurdles in accessing distribution channels, which can be a significant threat. Securing agreements with distributors and retailers is essential for reaching customers and gaining market share. Existing companies like O-I Glass often have established networks, creating a barrier for newcomers. This makes it difficult for new companies to get their products to consumers effectively.
- O-I Glass operates globally, with a strong distribution presence.
- Established distribution networks can include long-term contracts.
- New entrants may need to offer higher incentives to gain access.
- Limited access can impact sales and market penetration.
Glass Industry Entry: High Hurdles Ahead
The glass industry's high capital needs and economies of scale act as a significant barrier to new entrants. Brand loyalty also gives established firms like O-I Glass a competitive edge. Stringent regulations further increase these entry barriers by raising compliance costs and requiring specific expertise. Distribution channel access poses another hurdle, with established networks creating challenges.
| Barrier | Impact | Example (2024) |
|---|---|---|
| High Capital Costs | Deters new entrants | New plant costs hundreds of millions |
| Economies of Scale | Cost advantage for incumbents | O-I Glass's $5.5B cost of revenue |
| Brand Loyalty | Competitive edge | Established brands dominate market |
Porter's Five Forces Analysis Data Sources
O-I Glass's analysis employs company financials, industry reports, market share data, and competitor activities to gauge forces effectively.
