Philips Porter's Five Forces Analysis
Fully Editable
Tailor To Your Needs In Excel Or Sheets
Professional Design
Trusted, Industry-Standard Templates
Pre-Built
For Quick And Efficient Use
No Expertise Is Needed
Easy To Follow
Philips Bundle
What is included in the product
Analyzes competitive forces, customer influence, and market entry risks for Philips, offering strategic insights.
Philips Porter's Five Forces analysis helps you visually assess competitive forces and stay ahead of market changes.
What You See Is What You Get
Philips Porter's Five Forces Analysis
This preview presents the complete Philips Porter's Five Forces Analysis. This means that the analysis you see is identical to the document you'll download after purchase. Gain immediate access to a fully realized, ready-to-use strategic assessment.

Porter's Five Forces Analysis Template
Go Beyond the Preview—Access the Full Strategic Report
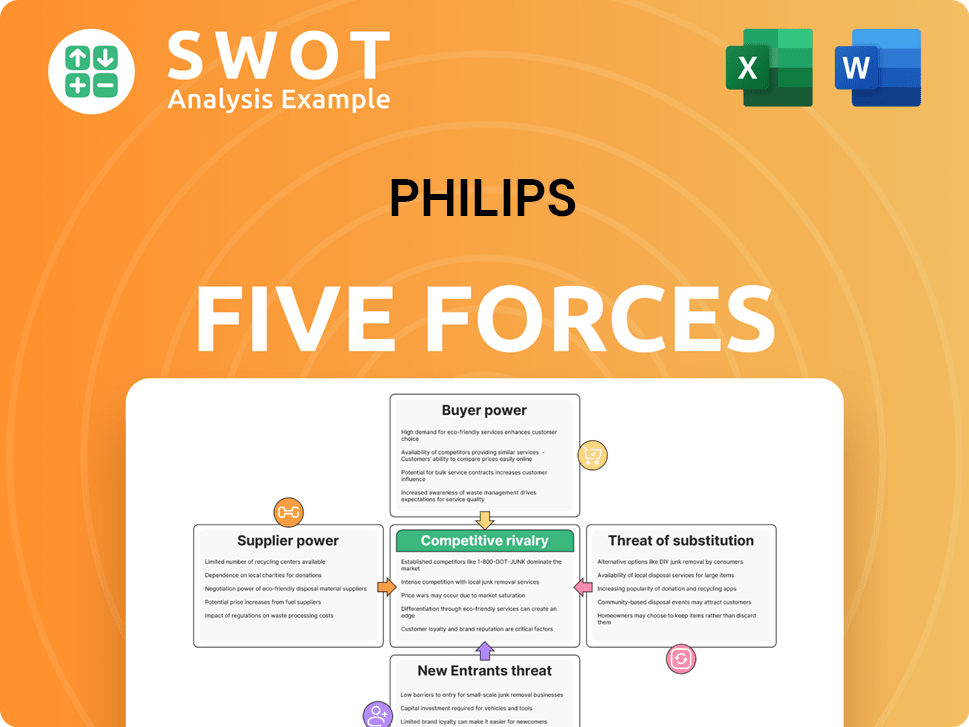
Philips operates within a dynamic healthcare technology landscape, influenced by five key competitive forces. The intensity of rivalry amongst existing players, like Siemens Healthineers, is significant. Buyer power, driven by healthcare providers, impacts pricing. Suppliers, particularly those providing components, exert influence, as do potential substitutes such as wearable health devices. The threat of new entrants, like emerging tech firms, adds another layer of competition. Ready to move beyond the basics? Get a full strategic breakdown of Philips’s market position, competitive intensity, and external threats—all in one powerful analysis.
Suppliers Bargaining Power
Supplier Concentration
Supplier concentration for Philips is moderate, but manageable due to its vast supplier network. Philips relies on about 7,000 global suppliers, reducing dependency risks. Strong supplier relationships enable favorable terms; joint ventures and agreements have cut specific component costs by roughly 10% over the last five years. This diversification strategy helps Philips maintain a balanced power dynamic.
Switching Costs
High switching costs elevate supplier power, especially for specialized components. Philips, for example, uses such components. Its healthcare division's proprietary imaging tech has high switching costs. The costs to switch suppliers could top $200 million.

Input Differentiation
Suppliers with unique inputs exert more power. Philips, focused on medical tech, needs special parts. The more unique the input, the more leverage suppliers hold. This includes patented tech, specialized materials, or unique processes. In 2024, Philips' cost of goods sold was $16.3B, highlighting supplier impact.
Threat of Forward Integration
The threat of suppliers integrating forward, while generally low, can still impact bargaining power. Philips has taken steps to control its supply chain. For example, Philips acquired a specialty component manufacturer in 2022 for around $150 million. This move helps reduce dependence on external suppliers and strengthens its market position.
- Forward integration by suppliers poses a moderate threat.
- Philips strategically acquired a component manufacturer.
- The 2022 acquisition cost approximately $150 million.
- Vertical integration enhances supply chain control.
Impact of Sustainability
Philips' sustainable procurement strategy significantly impacts supplier bargaining power. The company prioritizes suppliers with science-based carbon reduction targets, aiming for at least 50% of its suppliers to meet these goals by 2025. This focus on sustainability affects negotiation dynamics, favoring suppliers committed to environmental standards. It also strengthens Philips' position by promoting responsible end-of-life management, including refurbishment and recycling.
- Philips' 2023 Sustainable Procurement Spend: €1.9 billion.
- Target: 50% of suppliers with science-based targets by 2025.
- Focus: Responsible end-of-life management and circularity.
- Impact: Alters supplier negotiation dynamics.
Supplier Power Dynamics: A Strategic Overview
Philips' supplier bargaining power is shaped by its diverse supplier network and strategic acquisitions. Although switching costs can be high, especially for unique components, Philips manages this through its extensive supplier base and vertical integration efforts. Sustainable procurement practices further influence these dynamics.
| Aspect | Details | Impact |
|---|---|---|
| Supplier Base | 7,000 global suppliers. | Reduces dependency risks. |
| Switching Costs | Specialized components, potentially $200M to switch. | Elevates supplier power. |
| Forward Integration | Acquisition of component manufacturer in 2022 ($150M). | Enhances supply chain control. |
Customers Bargaining Power
Concentration of Buyers
The bargaining power of customers is notably high in the medical device industry. This is primarily because of the concentrated nature of large healthcare providers and hospital systems. These entities often make bulk purchases, which gives them substantial leverage in negotiating prices and other contract terms. For instance, in 2024, the top ten hospital systems in the U.S. accounted for over 20% of total healthcare spending, underscoring their significant buying power. The consolidation trend within the healthcare industry, with mergers and acquisitions, further amplifies the bargaining power of these major buyers.
Price Sensitivity
Customers, especially in healthcare, are highly price-sensitive due to budget constraints. Increased healthcare costs drive a focus on cost-effective solutions. Philips must offer competitive pricing and value to win contracts. This sensitivity is amplified by alternatives and competition. In 2024, healthcare spending in the US reached $4.8 trillion, highlighting price pressures.

Switching Costs
Switching costs significantly influence customer bargaining power for Philips. For instance, the high switching costs associated with Philips' medical equipment, like MRI machines, stem from substantial investments in training and system integration, thus reducing customer power. However, for simpler products like toothbrushes, switching is easy, increasing customer leverage. In 2024, Philips' revenue from Connected Care was EUR 5.5 billion, highlighting the impact of customer choices.
Availability of Information
Customers today wield significant bargaining power due to unprecedented access to information. Online resources, reviews, and comparisons enable informed choices, leveling the playing field for companies like Philips. This transparency allows customers to easily assess Philips' products against competitors. Increased information availability strengthens customer ability to negotiate prices and demand better terms.
- Online product reviews and comparison sites have seen a 25% increase in usage by consumers in 2024.
- Around 70% of consumers research products online before making a purchase.
- The average consumer reads 5-7 reviews before trusting a business.
- Price comparison websites are used by over 60% of online shoppers.
Government and Regulatory Influence
Government and regulatory bodies heavily shape customer choices in healthcare. Policies like reimbursement rules and safety standards directly affect demand for Philips' offerings. For instance, in 2024, changes in FDA regulations regarding medical device approvals could significantly alter purchasing behaviors. These shifts can either strengthen or weaken the bargaining power of customers.
- FDA approvals directly impact product demand.
- Reimbursement policies influence customer decisions.
- Safety standards affect customer preferences.
- Regulatory changes can shift customer power.
Medical Device Market: Customer Power Dynamics
Customers hold significant bargaining power in the medical device sector, particularly large healthcare providers negotiating bulk deals. Price sensitivity remains high due to cost pressures, intensified by readily available information online. High switching costs for complex equipment like MRI machines limit customer power, contrasting with simpler product ease. Government regulations also strongly influence customer choices, impacting demand and negotiating leverage.
| Factor | Impact on Customer Power | 2024 Data/Examples |
|---|---|---|
| Buyer Concentration | High | Top 10 US hospital systems: 20%+ healthcare spend. |
| Price Sensitivity | High | US healthcare spending: $4.8 trillion. |
| Switching Costs | Variable | MRI machines: high; toothbrushes: low. |
| Information Access | High | 70% research online before buying. |
| Regulations | Significant | FDA rules and reimbursement policies. |
Rivalry Among Competitors
Intense Competition
The health technology sector is highly competitive, involving numerous players. Philips contends with giants like GE Healthcare and Siemens Healthineers. These rivals constantly innovate, integrating advanced tech. For instance, in 2024, Siemens Healthineers reported €21.7 billion in revenue. This drives continuous industry evolution.
Innovation and R&D
Philips thrives on innovation, heavily investing in R&D to stay ahead. This commitment allows it to create advanced products, addressing consumer needs effectively. In 2024, R&D spending reached about EUR 1.7 billion, exceeding industry norms. This continuous investment boosts its competitive standing.

Market Fragmentation
The market is fragmented, featuring numerous competitors. Philips competes in healthcare, consumer electronics, and appliances. In 2024, Philips faced rivals like Siemens Healthineers and Samsung. This fragmentation requires a diversified strategy to remain competitive. Philips's 2023 revenue was around EUR 18.2 billion, highlighting the need to navigate this complex landscape.
High Exit Barriers
High exit barriers, stemming from significant R&D and infrastructure investments, amplify competitive rivalry. Consider Philips, a tech and healthcare giant. If Philips were to exit a sector, exit costs could range from $500 million to $1 billion. This forces companies to fight harder to survive.
- Exit costs can include severance pay, asset disposal, and contract termination fees.
- High barriers mean firms are locked into markets, intensifying competition.
- Philips' R&D spending in 2024 was approximately €2.5 billion.
- Such investments make it costly to abandon a market.
Geographic Considerations
Competitive rivalry is significantly influenced by geographic location. In China, Philips confronts obstacles like the anti-corruption campaign and economic slowdown, resulting in decreased demand. The company also contends with local Chinese competitors in the imaging market, intensifying competition. Philips anticipates a double-digit sales decline in China for the initial half of 2025, reflecting these pressures.
- China's GDP growth slowed to 5.2% in 2023, impacting demand.
- Philips' sales in China were down by 11% in Q4 2024.
- Local competitors like Mindray are gaining market share.
- Philips' strategic focus shifts to premium products in China.
Health Tech's Fierce Battle: Philips Navigates Challenges
Competitive rivalry in health tech is intense, involving numerous players like GE and Siemens. Philips combats high competition with significant R&D investments, aiming for product innovation. Geographic factors, such as China's economic slowdown, also affect competition. Philips anticipates double-digit sales decline in China for the first half of 2025.
| Factor | Impact | Data |
|---|---|---|
| Rivalry | High | Siemens Healthineers revenue: €21.7B (2024) |
| Innovation | Crucial | Philips R&D spend: ~€1.7B (2024) |
| Geographic | Significant | China sales decline forecast for H1 2025 |
SSubstitutes Threaten
Telehealth Services
Telehealth services are emerging as a substitute for traditional healthcare. The North American telehealth market, valued at $16 billion in 2019, is projected to hit $55 billion by 2026. This shift indicates growing consumer acceptance of virtual healthcare, potentially impacting Philips' traditional device sales. The increasing adoption poses a competitive threat.
Wearable Technology
The rise of wearable health tech presents a threat to Philips' traditional health monitoring devices. Competitors' wearable tech can directly challenge Philips' products. Consumer adoption of digital health tools jumped, with usage rising from 34% in 2022 to 43% in 2024. This shift indicates a growing preference for accessible health solutions, impacting Philips' market share.

AI-Powered Diagnostics
AI-powered diagnostics pose a threat to traditional diagnostic methods. AI algorithms are rapidly advancing, processing patient data to improve decision-making and care delivery. This includes early detection of conditions like cancer and heart disease. The global AI in healthcare market is projected to reach $61.07 billion by 2027, indicating significant growth and potential disruption.
Refurbished Medical Devices
Refurbished medical devices pose a threat to companies like Philips by providing cheaper alternatives. The market for these devices is substantial and growing. It's projected to reach $30.78 billion by 2029, up from $17.05 billion in 2024. This growth indicates a rising acceptance and demand.
- Cost Savings: Refurbished devices offer significant savings over new equipment.
- Market Growth: The refurbished medical device market is expanding rapidly.
- Sustainability: Refurbishment promotes sustainability by extending equipment life.
- Performance: Refurbished devices offer comparable performance to new ones.
Home-Based Care
Home-based care poses a significant threat to traditional healthcare models. Technological advancements are driving this shift, with the home becoming a primary care setting. While it enhances patient outcomes and eases hospital burdens, scaling remains complex. Infrastructure, adoption incentives, and provider workflows are key challenges.
- The global home healthcare market was valued at $304.1 billion in 2023.
- It's projected to reach $513.6 billion by 2030.
- North America held the largest market share in 2023.
- Telehealth adoption increased by 38% in 2024.
Healthcare's Shifting Sands: Substitutes Emerge
Telehealth, wearable tech, and AI diagnostics are growing substitutes, impacting traditional healthcare. The global telehealth market is predicted to reach $78.7 billion by 2026, up from $25.3 billion in 2023. Refurbished medical devices and home-based care also present threats.
| Substitute | Market Size (2024) | Projected Growth |
|---|---|---|
| Telehealth | $33.1B | $78.7B by 2026 |
| Wearables | $35.8B | $52.3B by 2028 |
| AI in Healthcare | $28.9B | $61.07B by 2027 |
Entrants Threaten
High Capital Requirements
The healthcare technology sector demands substantial upfront capital. Developing a new medical device can cost from $1 million to over $100 million. This includes research, development, and regulatory approvals. These high costs significantly deter new entrants.
Stringent Regulatory Approvals
Stringent regulatory approvals pose a substantial barrier to entry in the medical technology sector. Companies face complex, time-consuming processes, including FDA and EMA approvals. Compliance with quality, safety, and cybersecurity standards is crucial. This can involve significant costs; for instance, FDA premarket approval can cost over $30 million.

Established Brand Loyalty
Established players like Philips benefit from strong brand recognition and customer loyalty, presenting a significant barrier to new competitors. Building a trusted brand requires substantial time and financial resources, making it hard for new entrants to gain a foothold. Philips' brand strength is evident in its 68th position on the Best Global Brands 2023 list. This ranking reflects the company's strong market share and customer confidence.
Access to Distribution Channels
Access to distribution channels is a major barrier for new entrants, particularly in healthcare. Incumbent medical device companies like Medtronic and Johnson & Johnson have strong relationships with hospitals and healthcare providers. These established connections make it difficult for newcomers to get their products noticed and used. The existing distribution networks create a significant obstacle for new firms seeking market entry. In 2024, Medtronic's distribution expenses were approximately $6 billion, highlighting the investment needed to compete.
- Established Networks: Incumbents have deep-rooted relationships.
- High Costs: Building distribution is expensive.
- Market Dynamics: Healthcare is relationship-driven.
- Competitive Edge: Existing firms hold a key advantage.
Economies of Scale
Established companies like Philips leverage economies of scale in manufacturing, procurement, and marketing, giving them a significant cost advantage. This advantage allows them to offer competitive pricing and invest in innovation, making it tough for new entrants. Philips is actively pursuing cost efficiencies to strengthen its market position. The company aims for EUR 2.5 billion in productivity savings between 2023 and 2025.
- Economies of scale provide cost advantages.
- Established firms can offer competitive pricing.
- Philips targets EUR 2.5 billion in savings by 2025.
Barriers to Entry: High Costs and Regulations
High capital needs and regulatory hurdles deter new entrants. Strong brands like Philips and established distribution networks create substantial barriers. Incumbents benefit from economies of scale, offering competitive pricing.
| Factor | Impact | Example |
|---|---|---|
| Capital Requirements | High barriers | R&D for medical devices can cost $1M-$100M+ |
| Regulatory Approvals | Complex and costly | FDA premarket approval can cost over $30M |
| Brand Strength | Competitive advantage | Philips ranked 68th Best Global Brands 2023 |
Porter's Five Forces Analysis Data Sources
The analysis synthesizes information from Philips' annual reports, industry benchmarks, competitor analysis, and financial market data.
