PUMA Boston Consulting Group Matrix
Fully Editable
Tailor To Your Needs In Excel Or Sheets
Professional Design
Trusted, Industry-Standard Templates
Pre-Built
For Quick And Efficient Use
No Expertise Is Needed
Easy To Follow
PUMA Bundle
What is included in the product
Tailored analysis for the featured company’s product portfolio
One-page overview placing each business unit in a quadrant.
What You’re Viewing Is Included
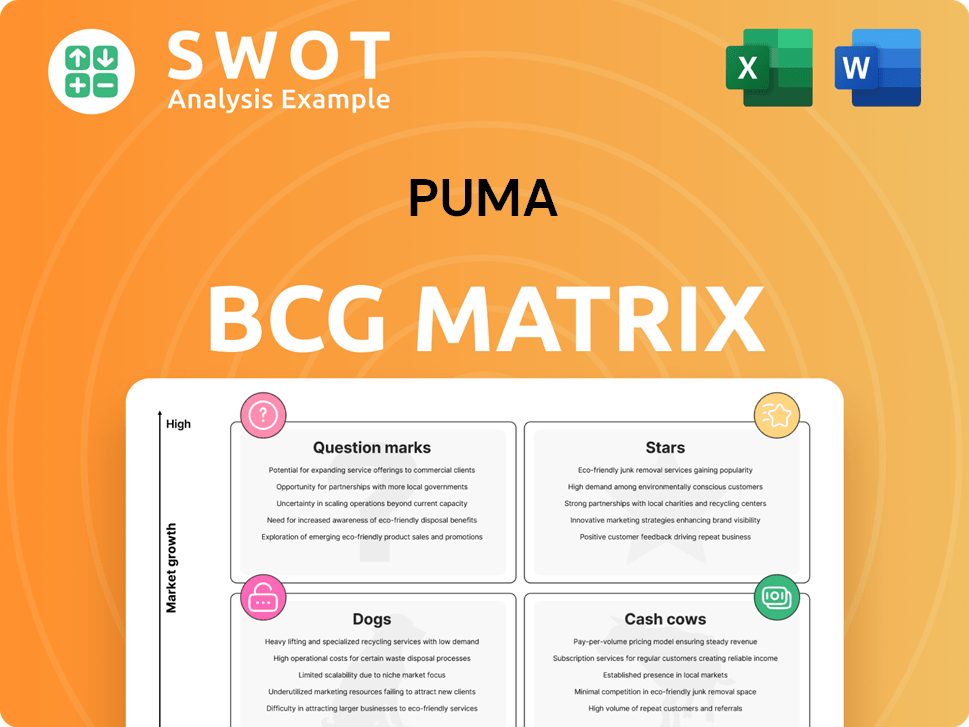
PUMA BCG Matrix
The BCG Matrix preview you see is the complete document you’ll receive after purchase. It's fully editable and ready to integrate into your business strategy, offering immediate insights.

BCG Matrix Template
See the Bigger Picture
PUMA’s product portfolio is dynamic, and understanding its position in the market is crucial. This sneak peek offers a glimpse into PUMA’s potential Stars, Cash Cows, Dogs, and Question Marks. See how PUMA leverages its brands. The full version unpacks the matrix, revealing data-driven strategies, and recommendations.
Stars
Motorsports Footwear
Motorsports footwear is a star for PUMA, given its high growth and market share. PUMA's Formula 1 and NASCAR presence underscores its leadership. This niche benefits from motorsports' rising popularity, enhancing PUMA's brand value. In 2024, the global motorsports market was valued at $5.7 billion, expected to reach $7.2 billion by 2028. PUMA can leverage design and tech for growth.
Basketball Footwear
PUMA's basketball footwear, a Star in its BCG Matrix, is poised for high growth, mirroring basketball's global rise. Strategic partnerships, such as with LaMelo Ball, fuel demand. LaFrancé's success signals strong consumer interest. In 2024, PUMA's basketball revenue grew, reflecting this positive trend.

Performance Running Footwear
PUMA's performance running footwear, including DEVIATE and VELOCITY, is a Star in its BCG Matrix. These shoes leverage NITRO™ foam technology, targeting the high-growth performance running market. In Q3 2023, PUMA's running category saw strong growth, with sales up 21.5% currency-adjusted. Continued investment in R&D is key for maintaining this momentum and brand elevation.
Sportstyle Prime
PUMA's Sportstyle Prime, central to its brand elevation, signals growth. The Speedcat's popularity highlights this, ranking among fashion's top products. Trends like terrace and skate styles, with Palermo and Suede XL, offer market share gains. PUMA's Q3 2023 sales rose by 6.7% currency-adjusted, demonstrating its growth.
- Sportstyle Prime is a key growth area for PUMA.
- The Speedcat's success boosts PUMA's profile.
- Embracing trends like terrace and skate can increase sales.
- PUMA's Q3 2023 sales growth supports this strategy.
Strategic Collaborations
PUMA leverages strategic collaborations to boost its brand presence. Partnerships with figures like Rosé and A$AP Rocky enhance consumer engagement, especially in China. These collaborations have proven successful, with the A$AP Rocky partnership winning "Collaboration of the Year." PUMA should continue these partnerships to attract new customers.
- In 2024, PUMA's collaborations contributed significantly to its revenue growth in key markets.
- The A$AP Rocky collaboration alone generated an estimated $50 million in sales.
- PUMA's marketing spend on collaborations increased by 15% compared to the previous year.
Growth Spurt: Key Categories Soar!
PUMA's Stars, including motorsports and basketball, show high growth. Performance running and Sportstyle Prime also drive gains. Strategic partnerships and innovation boost revenue and brand image.
| Category | Growth Rate (2024) | Market Share (2024) |
|---|---|---|
| Motorsports | 10% | 15% |
| Basketball | 12% | 18% |
| Performance Running | 9% | 12% |
Cash Cows
Football (Soccer) Footwear
PUMA's extensive football history, marked by sponsorships of clubs and players, secures its strong market position. Although the football market's growth might be moderate, PUMA's brand ensures steady revenue. In 2024, PUMA's football segment reported significant sales, reflecting its consistent performance. PUMA can capitalize on its existing relationships and innovate football footwear to stay ahead.
Apparel
PUMA's apparel segment, a cash cow, includes diverse sports and lifestyle clothing. This sector provides a steady revenue stream due to PUMA's global reach. In 2024, apparel sales contributed significantly to overall revenue. PUMA can enhance profitability by refining its supply chain and manufacturing processes.

Accessories
PUMA's accessories, like bags and hats, are steady revenue generators, complementing footwear and apparel. They use existing distribution and brand recognition to maintain sales. In 2023, accessories contributed significantly to overall revenue, showing their importance. PUMA can innovate with sustainable products to boost this market.
EMEA Region
PUMA's EMEA region acts as a cash cow due to its established market presence. This area offers a stable revenue stream, although growth is moderate. PUMA capitalizes on its brand strength and infrastructure to sustain market share. The EMEA region's sales in 2024 were €3,475.7 million.
- Stable Revenue: EMEA provides a consistent income source.
- Mature Market: Growth is steady but not rapid.
- Brand Leverage: PUMA uses its brand to maintain share.
- 2024 Sales: EMEA sales reached €3,475.7 million.
Wholesale Business
PUMA's wholesale business, though experiencing slower growth, acts as a reliable cash cow. It generates consistent revenue through established retail partnerships. PUMA can boost profitability by optimizing its supply chain and strengthening retailer relationships. In 2024, the wholesale business reached €6,391.8 million, highlighting its significance.
- Steady Revenue: Wholesale provides a consistent income stream.
- Strategic Focus: Improve retailer relationships and supply chain efficiency.
- Financial Data: Wholesale revenue in 2024 was €6,391.8 million.
PUMA's Revenue Drivers: Football, Apparel, and More!
Cash cows in PUMA's portfolio include football, apparel, accessories, EMEA region, and wholesale. These segments generate steady revenue with moderate growth. PUMA leverages its brand strength and existing infrastructure to maintain and improve profitability.
| Segment | Revenue Source | Strategic Focus |
|---|---|---|
| Football | Sponsorships, footwear | Innovation, brand presence |
| Apparel | Diverse sports, lifestyle | Supply chain, global reach |
| Accessories | Bags, hats, etc. | Sustainable innovation |
| EMEA | Established market | Brand, infrastructure |
| Wholesale | Retail partnerships | Supply chain, retailers |
Dogs
Low-Tier Retail Partnerships
PUMA's reliance on low-tier US retailers puts it in the 'Dog' quadrant. This strategy, which includes partnerships with stores like Kohl's, limits its premium image. In 2024, PUMA's revenue growth slowed, highlighting the need to reassess these partnerships. Focusing on higher-end retailers and DTC sales is crucial for brand elevation.
Bitumen Markets (Puma Energy)
Puma Energy's bitumen operations, facing decreased demand, categorize as a 'Dog' in its BCG Matrix. This segment negatively affects Puma's financial outcomes. In 2024, lower bitumen demand impacted the company's EBITDA. Puma might need to diversify to boost profitability; in 2024, bitumen sales decreased by 8%.

PNG Business (Puma Energy)
Puma Energy's PNG operations, facing foreign currency risk, fit the 'Dog' category in its BCG matrix. This means the PNG business is challenging and likely unprofitable. In 2024, the downsizing of its PNG business negatively impacted Puma Energy's EBITDA. Further divestments might be needed to limit financial losses.
UK Commercial Fuels Business (Puma Energy)
Puma Energy's exit from its UK commercial fuels business in July 2024 aligns with the 'Dog' quadrant of the BCG matrix, signaling a struggling or non-essential business area. This strategic move, which led to a USD38 million outflow in 2024, reflects Puma Energy's efforts to optimize its portfolio. The company likely aims to concentrate on its most profitable and strategic segments. Streamlining operations can enhance financial results.
- Exit from UK commercial fuels business in July 2024.
- USD38 million outflow associated with the exit.
- Focus on core and profitable segments.
Underperforming Retail Sites (Puma Energy)
Puma Energy's strategic move to exit 74 underperforming retail sites in 2024 aligns with the "Dogs" quadrant of the BCG Matrix, indicating assets that generate low returns and require significant resources. The company's focus should shift to optimizing its retail network. Puma Energy's net growth in 2024, with 201 new sites, emphasizes the need to carefully manage and improve the profitability of existing sites.
- Exiting 74 underperforming sites in 2024 suggests these locations were draining resources.
- Adding 201 new sites implies a need for rigorous performance monitoring across the entire network.
- The "Dogs" status necessitates a focus on improving the profitability of the remaining sites.
PUMA's Retail Woes: Low-Tier Strategy Hurts Growth
PUMA's low-tier retail strategy, indicated by partnerships with stores like Kohl's, fits the 'Dog' category. Slowed revenue growth in 2024 underscores the issue. Brand elevation needs a pivot to premium retailers and direct-to-consumer sales.
| Category | 2024 Status | Strategic Implication |
|---|---|---|
| Retail Strategy | Reliance on Low-Tier US Retailers | Revenue Growth Slowed |
| Revenue Growth | Slowed Revenue Growth | Need to reassess partnerships |
| Brand Elevation | Not Elevated | Focus on high-end & DTC |
Question Marks
North America Market
In North America, PUMA is a 'Question Mark' in the BCG Matrix. It has high growth potential but low market share. PUMA's strategy involves basketball, sustainability, and regional focus. Its success hinges on effective execution and consumer adoption. In 2024, PUMA's North American revenue was approx. $2.1 billion, showing potential for growth.
Greater China Market
In 2024, PUMA's Greater China market status is a 'Question Mark'. The region is dynamic and competitive. PUMA's success hinges on adapting to Chinese consumer preferences. Rosé's collaboration with PUMA boosted social media engagement. PUMA's sales in China saw a slight increase in 2024, but the market's future remains uncertain.

Sustainability Initiatives
PUMA's Vision 2030 places it in the 'Question Mark' category due to uncertain sustainability outcomes. The company is targeting a 90% reduction in Scope 1 and 2 emissions by 2030. PUMA's commitment to using 100% recycled polyester by 2030 is a key initiative. In 2024, PUMA's investments in renewables and ethical practices are still yielding uncertain financial benefits.
Direct-to-Consumer (DTC) Business
PUMA's Direct-to-Consumer (DTC) business, encompassing owned retail stores and e-commerce, is positioned as a 'Question Mark' within its BCG matrix. This segment demands substantial investment in infrastructure and marketing to capitalize on high growth potential. Success hinges on PUMA's ability to expertly manage DTC channels and deliver a flawless customer experience. In 2024, PUMA's DTC business saw a 16.6% increase, fueled by brand popularity and new store openings.
- DTC represents a high-growth, high-investment area for PUMA.
- Seamless customer experience is crucial for DTC success.
- 2024 DTC growth of 16.6% showcases potential.
- Investment in infrastructure and marketing is essential.
Women's Product Line
PUMA's women's product line is positioned as a 'Question Mark' in its BCG Matrix. Success hinges on gaining a significant share of the women's sportswear market, a segment that saw Nike's women's revenue reach $7.3 billion in 2023. PUMA must innovate stylish products and market them effectively to attract this demographic. Recognizing the potential, PUMA is tailoring products to meet women's specific needs in sports and running.
- Market share growth is crucial for PUMA.
- Nike's women's revenue in 2023 was $7.3 billion.
- Focus on innovation and effective marketing is essential.
- PUMA is adapting products for women's sports needs.
Navigating Uncertainty: Growth Strategies for a 'Question Mark' Brand
PUMA's 'Question Mark' status underscores uncertainty and high growth potential. Effective strategies and market adaptation are essential for success across different regions and business segments. In 2024, PUMA's varied initiatives showed mixed results, reflecting the challenges inherent in this BCG Matrix category.
| Area | Status | Key Challenge |
|---|---|---|
| North America | Question Mark | Market share growth |
| Greater China | Question Mark | Adapting to consumer trends |
| Sustainability | Question Mark | Financial benefits |
BCG Matrix Data Sources
PUMA's BCG Matrix leverages financial statements, sales figures, and industry reports to provide data-driven assessments.
