PUMA Porter's Five Forces Analysis
Fully Editable
Tailor To Your Needs In Excel Or Sheets
Professional Design
Trusted, Industry-Standard Templates
Pre-Built
For Quick And Efficient Use
No Expertise Is Needed
Easy To Follow
PUMA Bundle
What is included in the product
Examines the competitive landscape for PUMA, highlighting key forces shaping its success.
Identify competitive threats fast with a concise, visual force diagram.
What You See Is What You Get
PUMA Porter's Five Forces Analysis
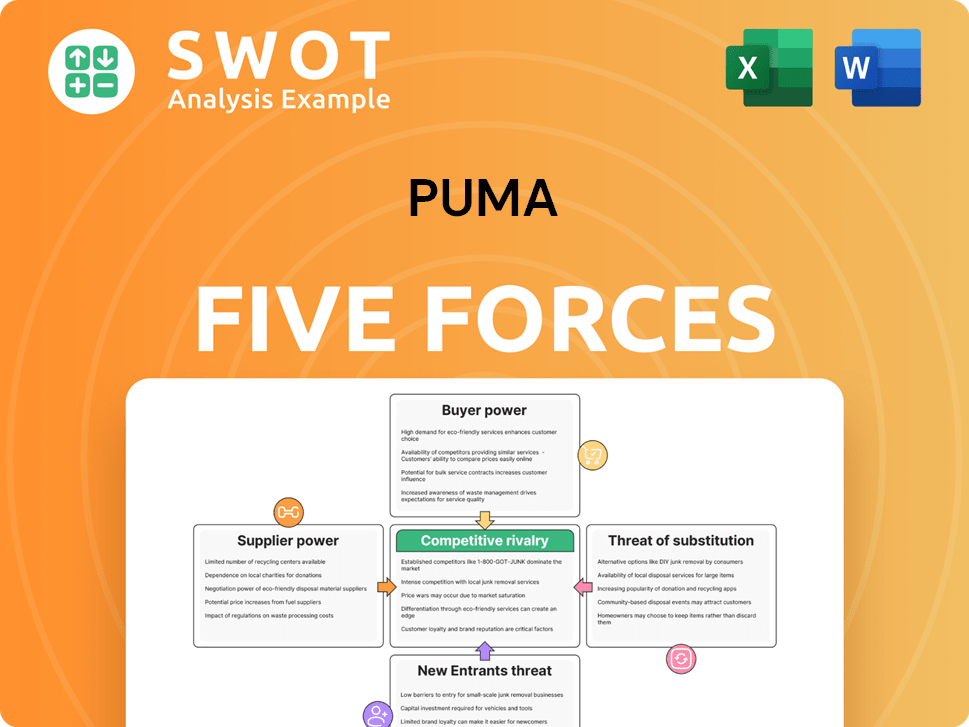
This preview details PUMA's Porter's Five Forces analysis. It examines competitive rivalry, supplier power, buyer power, threat of substitutes, and threat of new entrants. The document is fully researched, providing a strategic market overview. This is the same professionally crafted analysis you’ll receive upon purchase. It is immediately downloadable.

Porter's Five Forces Analysis Template
From Overview to Strategy Blueprint
PUMA faces competition from established giants and emerging athletic wear brands, with moderate rivalry intensity. The bargaining power of suppliers, like materials producers, is relatively low. Buyer power is moderate due to consumer choice. Threat of new entrants is considerable given market growth, but brand recognition is a barrier. Substitute products (e.g., other apparel) pose a moderate threat.
This brief snapshot only scratches the surface. Unlock the full Porter's Five Forces Analysis to explore PUMA’s competitive dynamics, market pressures, and strategic advantages in detail.
Suppliers Bargaining Power
Supplier Concentration
PUMA's extensive supplier network, mainly in Asia (Vietnam, China, Bangladesh), limits supplier power. Multiple manufacturers and PUMA Group Sourcing (PGS) further reduce supplier influence. This strategy ensures competitive pricing and supply stability. In 2024, PUMA sourced from over 100 factories, showcasing its diversified approach.
Sourcing Management
PUMA Group Sourcing (PGS) actively manages vendor selection, product development, and price negotiations, strengthening its control over suppliers. This proactive management helps PUMA achieve competitive pricing. In 2024, PUMA's sourcing strategy aimed to diversify its supplier base, reducing reliance on single vendors. Regular portfolio adjustments enhance PUMA's bargaining power, allowing it to dictate terms effectively. This approach keeps supplier power under control.

Raw Material Availability
PUMA's raw material sourcing, like cotton from Africa, affects supplier power. Limited supply or specialized materials can increase supplier leverage. However, PUMA diversifies sourcing to reduce dependence. In 2024, cotton prices showed volatility, impacting apparel costs. PUMA's strategy helps manage these fluctuations.
Supplier Switching Costs
PUMA's vulnerability lies in supplier switching costs. Manufacturers might become competitors, launching their own brands. Once inventory sells, switching to PUMA's rivals is easy. This ease of switching keeps suppliers' power in check. In 2024, the global sportswear market hit $400 billion, highlighting the stakes.
- Forward integration risk exists, but switching is easy.
- Manufacturers can quickly shift to competitors.
- This balance limits supplier control over PUMA.
- Sportswear market reached $400B in 2024.
PUMA's Order Volume
PUMA's significant order volumes are a key factor in its relationship with suppliers. The company's substantial purchasing power, especially in clothing and footwear, gives it leverage in negotiations. This helps PUMA secure favorable terms and pricing from its suppliers. This ensures suppliers remain competitive and responsive to PUMA's demands, reinforcing PUMA's position in the supply chain.
- PUMA's revenue in 2023 was approximately €8.6 billion.
- PUMA's strong financial performance allows it to negotiate effectively.
- PUMA sources from various suppliers to maintain its bargaining power.
- PUMA's global presence supports its supply chain strategy.
PUMA's Supply Chain: Power Dynamics
PUMA’s diverse supplier network and PGS management limit supplier power, ensuring competitive pricing. In 2024, the sportswear market reached $400B, highlighting the stakes in supply chain negotiations. PUMA’s revenue in 2023 was approximately €8.6 billion, enhancing its bargaining power. Easy switching to competitors further keeps suppliers in check.
| Aspect | Details | Impact |
|---|---|---|
| Supplier Network | Over 100 factories in 2024. | Reduces supplier influence. |
| Sourcing Strategy | Diversification & active management. | Competitive pricing & control. |
| Revenue | €8.6 billion in 2023. | Strong negotiation position. |
Customers Bargaining Power
Customer Switching Costs
Individual customers have little power due to small purchase volumes, but switching brands is easy. This reduces loyalty, pushing PUMA to innovate and offer competitive pricing. In 2024, PUMA's focus on digital channels and diverse product lines aimed to boost customer retention amid rising competition. The brand's global marketing spending in 2023 was €652 million. PUMA needs a strong value proposition to retain customers.
Retail Channel Influence
PUMA's customer bargaining power is shaped by its retail strategy. The company uses retail partners, its own stores, and e-commerce. Wholesale deals with retailers offer a lower-risk, high-volume approach. In 2024, PUMA's direct-to-consumer sales, including e-commerce, accounted for approximately 30% of total sales, showing its focus on diverse channels.

Athlete Endorsements
Popular athletes significantly impact brand perception and consumer choices, giving them considerable bargaining power. PUMA strategically uses endorsements to boost its appeal and build credibility within the market. However, the brand faces potential risks, such as negative publicity, if an endorsement deal goes sour. Managing these relationships is vital for preserving brand equity and ensuring customer loyalty. In 2024, PUMA's marketing spend was approximately $700 million, a significant portion of which is allocated to athlete endorsements.
Retailer Brand Potential
Retailers, both established and emerging, have the means to launch their clothing lines, posing a challenge to brands like PUMA. This could displace PUMA's apparel from shelves. Yet, such moves risk alienating customers loyal to PUMA, who might avoid stores lacking its products. This creates a tug-of-war, forcing PUMA to strengthen its brand and customer loyalty.
- In 2024, private-label brands captured roughly 20% of the U.S. apparel market.
- Major retailers like Amazon and Target have expanded their private-label offerings.
- PUMA's revenue for 2023 was approximately €8.6 billion, showing its significant market presence.
- Customer loyalty programs and brand recognition are crucial for PUMA to maintain its market share.
Price Sensitivity
Customers' price sensitivity significantly influences PUMA's pricing strategies, as consumers can easily switch to competitors. This power allows customers to negotiate prices, pushing PUMA to be competitive. PUMA has adjusted prices, especially in the mid-end segment, to counter cheaper alternatives. The brand must balance its premium image with price competitiveness to retain customers.
- In 2024, PUMA's gross profit margin decreased slightly due to increased promotional activities and competitive pricing pressures.
- PUMA's average selling prices have been under pressure in certain regions, particularly in the apparel segment, due to competition.
- The sportswear market is highly competitive, with brands like Nike and Adidas offering various price points.
Market Dynamics: Customer, Retailer, and Price Impact
Customers' influence varies. Individual buyers have limited power, but switching costs are low. Retailers’ private labels and athlete endorsements affect PUMA. Price sensitivity requires competitive strategies, impacting margins.
| Factor | Impact | 2024 Data |
|---|---|---|
| Customer Base | Moderate | Loyalty programs crucial |
| Retailer Power | High | Private labels gained 20% U.S. apparel market |
| Price Sensitivity | High | Margin pressure, competitive pricing |
Rivalry Among Competitors
Market Dominance
PUMA competes fiercely with Nike and Adidas, who dominate the global sports market. These giants boast immense resources and brand power, creating a challenging environment. In 2024, Nike's revenue reached approximately $51.2 billion, while Adidas generated around $21.4 billion. PUMA must innovate and market effectively to retain its position.
Product Comparability
PUMA faces intense rivalry due to high product comparability. Consumers can easily switch between brands like Adidas and Nike without extra costs. This substitutability forces PUMA to innovate, as seen with its 2024 collaborations. Brand loyalty and differentiation are vital; in 2023, PUMA's revenue was €8.6 billion, showing its need to stand out.

Industry Growth
The sporting goods industry's projected growth offers opportunities, potentially easing rivalry. However, increased competition and market saturation could intensify it. New sports segments attract new competitors, increasing rivalry. Adapting to changes is critical for maintaining a competitive edge. The global sports market was valued at $485 billion in 2023.
Brand Recognition
PUMA, despite its strong brand heritage and celebrity collaborations, faces stiff competition in brand recognition, particularly from industry giants Nike and Adidas. In 2024, Nike's brand value was estimated at over $150 billion, significantly outpacing PUMA's valuation. To compete, PUMA must prioritize enhancing its brand equity to capture and retain market share. Strategic marketing and partnerships are crucial.
- Nike's brand value surpassed $150 billion in 2024.
- PUMA's brand recognition lags behind key competitors.
- Strategic initiatives are vital for brand image improvement.
- Customer loyalty is a key focus area for PUMA.
Global Presence
The athletic footwear and apparel market is fiercely competitive on a global scale. PUMA faces significant rivalry from major players like Nike, Adidas, New Balance, and Reebok. Nike and Adidas pose the most substantial threat due to their extensive global presence and financial muscle. For instance, in 2024, Nike's revenue reached approximately $51.2 billion, while Adidas generated around $21.4 billion. This financial strength allows them to invest heavily in marketing, innovation, and distribution.
- Nike's 2024 revenue: ~$51.2B.
- Adidas's 2024 revenue: ~$21.4B.
- Competition includes New Balance & Reebok.
- Global presence is key in the market.
PUMA's Market Battle: Revenue & Rivals
PUMA faces intense competition, especially from Nike and Adidas, who have significantly higher revenues. The athletic footwear market is highly competitive, with many brands vying for market share. To compete, PUMA must focus on innovation and brand enhancement.
| Metric | Nike (2024) | Adidas (2024) | PUMA (2023) |
|---|---|---|---|
| Revenue | ~$51.2B | ~$21.4B | €8.6B |
| Brand Value | $150B+ | - | - |
| Market Share | Significant | Significant | Competitive |
SSubstitutes Threaten
Technological Innovation
PUMA's investment in R&D has yielded proprietary tech like NITRO and HYBRID, which are hard to substitute. For pro athletes, functionality trumps all, and substitutes are few. Continuous innovation in tech and design is critical for a competitive edge. In 2024, PUMA invested $250 million in R&D. This strategy secured its market position.
Style and Look
The style and look of sportswear are easily copied; budget brands often mimic designs. Counterfeit goods are also a threat, impacting PUMA's sales. In 2024, the global sportswear market was valued at approximately $400 billion, with knockoffs accounting for a significant portion. PUMA needs continuous innovation in design to stay ahead.

Brand Perception
Many view branded sportswear as a status symbol, driving demand for premium products. This encourages cheaper brands to mimic designs, capitalizing on trends. Replicas also thrive, highlighting the importance of brand image. In 2024, counterfeit sportswear sales reached $40 billion globally, underscoring the threat. Maintaining a strong brand is vital to justify higher prices.
Distribution Network
The sports equipment market features numerous retailers selling apparel and footwear, making substitutes a real threat. PUMA combats this through its distribution network, which includes branded stores and online platforms. A robust distribution network is crucial for reaching customers and ensuring sales. In 2024, PUMA's direct-to-consumer sales represented a significant portion of its revenue, showing the importance of its network.
- Competition from retailers offering substitute products is a constant challenge.
- PUMA's direct sales channels are crucial for mitigating this threat.
- A strong distribution network supports sales volume and brand visibility.
- Direct-to-consumer sales show the impact of PUMA's distribution.
Counterfeit Products
PUMA faces the threat of counterfeit products in the sportswear market, which can harm its brand reputation and reduce sales. Counterfeit goods undermine PUMA's intellectual property, necessitating strong brand protection measures. Maintaining brand integrity and customer trust is crucial, especially given the prevalence of online sales, where counterfeits often emerge. PUMA must actively combat these imitations to preserve its market position. In 2024, the global market for counterfeit goods was estimated at $2.8 trillion.
- Counterfeit products erode brand value and customer trust.
- PUMA must invest in anti-counterfeiting technologies and strategies.
- Legal action and collaborations are vital to combat fake goods.
- Focus on supply chain security to minimize counterfeiting risks.
PUMA's Defense: Tech, Sales, and Counterfeit Combat
The threat of substitutes for PUMA comes from both design and retail. Budget brands and counterfeit goods pose a challenge. PUMA's focus on proprietary tech and direct sales helps mitigate these risks.
| Aspect | Details | 2024 Data |
|---|---|---|
| Counterfeit Market | Impact on brand and sales | $40B in counterfeit sportswear sales globally |
| Direct-to-Consumer | Importance for mitigating substitutes | Significant % of PUMA's revenue |
| R&D Investment | Mitigating substitute risk | $250 million in R&D |
Entrants Threaten
Capital Requirements
High capital investments are essential for new sportswear brands to compete with PUMA in design, development, and distribution. Moderate economies of scale mean costs plateau after a certain production volume. The need for significant capital acts as a barrier, deterring many new entrants. For example, marketing spend by major brands like Nike and Adidas exceeded $3.5 billion in 2024.
Distribution Channels
PUMA's established retail partnerships are key to its distribution. In 2024, retail sales accounted for a substantial portion of revenue. The brand's investment in multi-channel distribution centers further strengthens its position. New entrants face high barriers due to the difficulty of accessing these channels.

Niche Market Rise
The emergence of niche market players is a significant threat. These companies often focus on specific customer segments. They leverage online distribution to reach consumers directly. In 2024, e-commerce sales in the athletic footwear market were projected to reach $18 billion, highlighting the shift. PUMA needs to adapt to these changing dynamics.
Brand Recognition
PUMA's brand recognition is a strong defense against new competitors, even online. Its well-established brand and loyal customer base pose a significant challenge for newcomers. Building comparable brand recognition requires substantial investment and time. This gives PUMA a considerable advantage in the market. In 2024, PUMA's brand value reached approximately $6.8 billion, reflecting its strong market position.
- Customer loyalty provides a barrier.
- Building brand recognition is costly.
- PUMA's brand value is substantial.
Regulatory Compliance
New entrants in the market face fewer hurdles due to limited government regulations, enabling smaller companies to establish themselves more easily [1]. PUMA must continuously adapt to evolving regulations, spanning labor practices, environmental standards, and international trade agreements [1, 2]. Staying compliant and adaptable is essential for PUMA to maintain its competitive edge and ensure long-term sustainability [1, 3]. These regulatory adjustments can impact operational costs and strategic decisions, affecting overall profitability.
- Regulatory changes can increase operational costs.
- Adaptation is crucial for sustainable business practices.
- Compliance impacts strategic decisions.
- New entrants benefit from fewer initial regulatory hurdles.
Athletic Footwear: Navigating Market Hurdles
New entrants face high capital needs, like substantial marketing spending, which reached over $3.5 billion in 2024 for major brands. Established retail partnerships also pose a challenge, with retail sales being a key revenue source in 2024. Niche players, however, leverage e-commerce; online athletic footwear sales hit an estimated $18 billion in 2024.
| Barrier | Challenge | Impact on PUMA |
|---|---|---|
| High capital investment | Marketing spend | $3.5B (2024) |
| Distribution access | Retail partnerships | Key revenue source |
| Niche market entry | E-commerce growth | $18B sales (2024) |
Porter's Five Forces Analysis Data Sources
The PUMA analysis leverages financial reports, market research, industry publications, and competitive intelligence from reliable sources.
