SK Porter's Five Forces Analysis
Fully Editable
Tailor To Your Needs In Excel Or Sheets
Professional Design
Trusted, Industry-Standard Templates
Pre-Built
For Quick And Efficient Use
No Expertise Is Needed
Easy To Follow
SK Bundle
What is included in the product
Uncovers key drivers of competition, customer influence, and market entry risks tailored to the specific company.
Instantly identify competitive threats with a visual summary, guiding strategic choices.
What You See Is What You Get
SK Porter's Five Forces Analysis
This preview provides a complete Five Forces analysis. The analysis includes detailed explanations of each force influencing the industry. It's professionally written and formatted. Once purchased, you receive the exact file. You'll have immediate access.

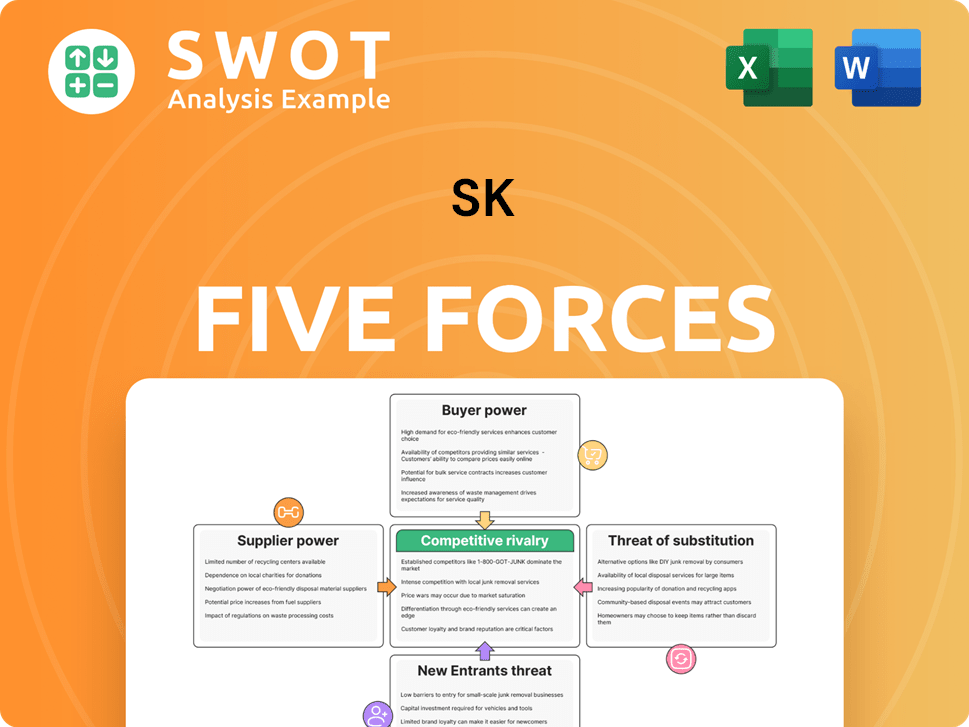
Porter's Five Forces Analysis Template
A Must-Have Tool for Decision-Makers
SK's industry faces complex competitive dynamics. Buyer power, stemming from diverse consumer preferences, significantly impacts pricing. The threat of substitutes, like alternative energy sources, poses a challenge. New entrants, driven by technological advancements, add further pressure. Supplier influence on SK's costs is also a key factor. Understanding these forces is crucial for any stakeholder.
This preview is just the beginning. Dive into a complete, consultant-grade breakdown of SK’s industry competitiveness—ready for immediate use.
Suppliers Bargaining Power
Supplier Concentration
Supplier concentration significantly impacts bargaining power. When suppliers are few, their influence grows. Consider the EV battery sector, where lithium suppliers hold sway. Albemarle and SQM, by 2023, controlled roughly 40% of the global lithium supply.
Switching Costs
High switching costs significantly boost supplier power. For example, if a manufacturer switches to a new raw material, it could involve costly testing and modifications, with expenses potentially exceeding $1 million. This financial barrier makes it difficult for companies to switch suppliers, solidifying the supplier's leverage.

Demand Fluctuations
Rising demand in the EV market amplifies supplier power. With EV sales expected to grow significantly, suppliers gain leverage in negotiations. SK Inc. needs to manage these fluctuations to ensure stable supply chains. In 2024, global EV sales are projected to reach 16 million units, up from 10.8 million in 2023, increasing supplier bargaining power.
Vertical Integration
The threat of vertical integration from suppliers is significant in SK Porter's analysis. Suppliers, such as those providing raw materials for batteries, could vertically integrate and begin manufacturing batteries themselves, bypassing SK Inc. This move would diminish SK Inc.'s control and bargaining power. To mitigate this, SK Inc. must cultivate robust supplier relationships and diversify its sourcing options. For example, in 2024, the price of lithium, a key battery component, saw fluctuations, highlighting the importance of these strategies.
- Supplier vertical integration threatens SK Inc.'s bargaining power.
- Suppliers may manufacture batteries, bypassing SK Inc.
- SK Inc. must maintain strong supplier relationships.
- Alternative sourcing strategies are crucial for SK Inc.
Specialized Materials
Suppliers of specialized materials, vital for SK Inc.'s diverse operations, wield substantial bargaining power. This is especially true in sectors like semiconductors, where securing rare earth elements is crucial. SK Inc. needs to manage this by establishing long-term supply contracts and fostering supplier relationships. For instance, in 2024, the price of lithium, essential for EV batteries, saw fluctuations, highlighting supply chain vulnerabilities.
- Long-term contracts help stabilize costs.
- Diversification reduces dependency on single suppliers.
- Price volatility necessitates hedging strategies.
- Technological advancements impact material demand.
EV Market: Supplier Power Dynamics
Supplier bargaining power is intensified by concentration and high switching costs. Rising demand in the EV market, projected to hit 16 million units in 2024, further strengthens their position. The threat of supplier vertical integration demands strong supplier relationships and diversification.
| Factor | Impact | Example (2024) |
|---|---|---|
| Supplier Concentration | Increased Power | Lithium suppliers control 40% of supply |
| Switching Costs | Higher Leverage | Cost of switching raw materials: >$1M |
| Market Demand | Enhanced Position | EV sales projected: 16M units |
Customers Bargaining Power
Concentrated Customer Base
If a few major customers account for a significant portion of SK Inc.'s revenue, their bargaining power grows. They can push for lower prices or favorable terms, directly impacting profitability. In 2024, SK Hynix, a key subsidiary, generated 22% of its revenue from one major customer. Diversifying the customer base is crucial to mitigate this risk.
Price Sensitivity
Price sensitivity is a key aspect of customer bargaining power. In sectors like commodity chemicals, customers are highly price-sensitive, pressuring companies like SK Inc. to offer competitive prices. This can lead to margin compression. SK Inc. might consider value-added services or product differentiation to counter this pressure. In 2024, the global chemical market was valued at approximately $5.7 trillion, with price competition being fierce.

Switching Costs for Buyers
Switching costs significantly influence customer power. If buyers face low switching costs, their power increases. SK Inc. must prioritize customer loyalty. Data from 2024 shows customer retention costs are up 15% for similar firms, highlighting the need for superior offerings.
Availability of Substitutes
The availability of substitute products significantly increases customer bargaining power. If alternative energy sources, like solar or wind power, become more cost-effective, customers have the option to switch from SK Inc.'s offerings. Continuous innovation is vital to maintain a competitive edge in such a dynamic market. This strategic approach is essential to counteract the impact of readily available substitutes and retain customer loyalty.
- In 2024, the global renewable energy market is projected to reach over $1 trillion.
- The cost of solar energy has decreased by over 80% in the last decade.
- SK Inc. invested heavily in renewable energy projects in 2023, totaling $5 billion.
- Customer switching costs play a crucial role in this dynamic.
Customer Information
Customer information significantly shapes their bargaining power. Informed customers, armed with market and cost data, can negotiate prices. Transparency in SK Inc.'s operations and value communication are vital. The ability to switch to competitors also impacts this. In 2024, customer reviews and online price comparisons will continue to be key factors.
- Price Sensitivity: Customers' willingness to switch based on price.
- Information Access: Availability of data on costs, market prices, and competitors.
- Switching Costs: The expenses or difficulties associated with changing suppliers.
- Concentration: The number of customers relative to the number of suppliers.
Customer Power: Profitability's Silent Driver
Customer bargaining power significantly impacts profitability. Major customers, like SK Hynix, hold substantial sway. Price sensitivity and switching costs are key factors. Innovation and value-added services are critical.
| Factor | Impact | 2024 Data |
|---|---|---|
| Customer Concentration | High Power | SK Hynix: 22% revenue from one client |
| Price Sensitivity | High Power | Global chemical market: $5.7T, fierce competition |
| Switching Costs | Low Power | Customer retention costs up 15% |
Rivalry Among Competitors
Industry Consolidation
Mergers and acquisitions (M&A) can heighten competition within an industry. As the sector consolidates, surviving companies grow, intensifying rivalry. For example, in 2024, global M&A activity reached $2.9 trillion, signaling increased competition. SK Inc. must watch these trends and adjust its strategies to stay competitive.
Market Share
Market share significantly shapes competition. When a few firms control most of the market, rivalry intensifies. SK Inc. should focus on boosting its market share, which was approximately 2.5% in 2024, through smart investments. This growth can be achieved by innovation to stay ahead of rivals.

Growth Rate
Slower industry growth often intensifies competition, a key factor in SK Inc.'s competitive landscape. In mature markets, like some of SK Inc.'s existing sectors, companies aggressively pursue market share. This can lead to price wars and squeeze profit margins. For SK Inc., this means exploring growth in emerging markets or venturing into new business areas to stay competitive. For example, in 2024, the global semiconductor market grew by only 4%, indicating a mature market where SK Hynix, a key SK Inc. subsidiary, faces intense rivalry.
Product Differentiation
Low product differentiation intensifies rivalry within an industry. When products are perceived as similar, consumers readily switch based on price or convenience, fueling price wars. For example, in the EV battery market, where SK On competes, differentiation through superior energy density or charging speed is crucial. SK Inc. needs to emphasize unique product features and services to reduce price sensitivity and gain a competitive edge. A recent report shows that the global electric vehicle battery market was valued at $58.8 billion in 2023.
- Focus on innovation to create unique features.
- Develop strong branding to build customer loyalty.
- Invest in R&D for product differentiation.
- Offer exceptional customer service.
Exit Barriers
High exit barriers, such as specialized assets or long-term contracts, can trap companies in an industry, even if they're losing money. This scenario often leads to overcapacity and fierce price wars, as firms desperately try to cover fixed costs. For SK Inc., evaluating its strategic options and being ready to divest from underperforming segments is crucial. For instance, in 2024, the semiconductor industry faced price competition due to overcapacity.
- High exit barriers can exacerbate price wars.
- Firms with high fixed costs may struggle to exit.
- Strategic flexibility is key for SK Inc.
- Overcapacity can significantly reduce profitability.
SK Inc.'s Competitive Edge: M&A, Market Share, and Innovation
Competitive rivalry intensifies with mergers and acquisitions; In 2024, global M&A reached $2.9T. Slow industry growth and low product differentiation also fuel competition. SK Inc. should focus on innovation and strong branding to stay competitive.
| Factor | Impact on Rivalry | SK Inc. Action |
|---|---|---|
| M&A Activity | Increases competition | Monitor M&A trends |
| Market Share | Intensifies rivalry | Boost market share (2.5% in 2024) |
| Industry Growth | Slower growth intensifies | Explore new markets |
| Product Differentiation | Low diff. increases | Emphasize unique features |
SSubstitutes Threaten
Availability of Substitutes
The availability of substitutes presents a notable threat. Renewable energy sources, like solar and wind, are substitutes for fossil fuels. In 2024, the global renewable energy capacity increased, with solar leading the growth. SK Inc. must invest in and adapt to these shifts.
Price Performance
The price performance of substitute products significantly impacts SK Inc.'s market position. If substitutes provide comparable functionality at a lower price point, customers are likely to switch. SK Inc. must focus on improving its cost structure to stay competitive. For instance, in 2024, the average price of electric vehicle batteries, a key SK product, decreased by about 14%, reflecting the pressure from alternative energy solutions.

Switching Costs
Low switching costs amplify the threat of substitutes. For instance, if customers can effortlessly swap to competitors offering similar products, the risk surges. SK Inc. needs to cultivate customer loyalty to mitigate this threat. Consider that in 2024, the average customer churn rate in the tech sector was around 10-15%, highlighting the need for strategies to retain customers. Increasing switching costs, perhaps through bundled services or exclusive offerings, can provide a competitive edge.
Technological Advancements
Technological advancements pose a threat to SK Inc. as they can introduce new substitutes. For instance, improvements in battery technology could offer alternatives to SK's current battery offerings. This necessitates continuous innovation and robust R&D investments to stay competitive. In 2024, SK Innovation invested $2.6 billion in R&D. These investments are crucial for mitigating the risk of substitution.
- Rapid technological changes can make existing products obsolete.
- Battery technology advancements can directly compete with SK's battery business.
- SK needs to continuously innovate to stay ahead of potential substitutes.
- R&D spending is critical for maintaining a competitive edge.
Buyer Propensity to Substitute
Buyer propensity to substitute significantly impacts SK Inc.'s market position. The openness of buyers to alternatives directly influences the threat level. Understanding customer needs is crucial for SK Inc. to tailor its offerings effectively and reduce this threat. This involves constant market research and analysis to stay ahead of changing preferences.
- Customer loyalty programs can reduce the threat by incentivizing repeat purchases.
- Product differentiation is key to making SK Inc.'s offerings stand out.
- Competitive pricing strategies can deter buyers from switching to cheaper alternatives.
- Investing in innovation to offer unique features.
Adapting to Substitutes: A Market Survival Guide
The threat of substitutes significantly impacts SK Inc.'s market. Renewable energy sources and advancements in battery tech directly compete. Continuous innovation and strategic pricing are crucial to mitigate these risks and retain market share. In 2024, global renewable energy capacity surged, highlighting the need for adaptation.
| Mitigation Strategy | Impact | 2024 Data Point |
|---|---|---|
| Product Differentiation | Enhances customer loyalty | Average customer churn rate ~10-15% in tech |
| Competitive Pricing | Deters switching | EV battery prices down ~14% |
| R&D Investment | Innovation, new features | SK Innovation R&D spending: $2.6B |
Entrants Threaten
Capital Requirements
High capital requirements pose a significant barrier to new entrants. Industries such as energy and chemicals demand substantial upfront investments, hindering new companies. In 2024, SK Inc. benefited from these high barriers, with its energy sector investments totaling billions of dollars. This advantage allows SK Inc. to maintain its market position. The substantial capital needed to compete effectively limits the number of potential rivals.
Regulatory Hurdles
Regulatory hurdles pose a significant threat to new entrants. Stringent regulations, especially in sectors like biopharmaceuticals, demand extensive approvals. SK Inc.'s established expertise in this area grants it a competitive edge. New firms face high costs and time delays to comply with regulations, hindering market entry. This advantage is reflected in SK Inc.'s strong market position and profitability, with a 2024 revenue of approximately $85 billion.

Access to Distribution
Existing firms often dominate distribution networks and supply chains, giving them a significant advantage. New entrants face a tough challenge in building their supply chains, acting as a major entry barrier. For example, in 2024, established beverage companies held over 80% of supermarket shelf space.
Brand Loyalty
Strong brand loyalty significantly hinders new competitors. If customers are devoted to existing brands, new entrants struggle to capture market share. SK Inc., as of late 2024, benefits from robust brand recognition. This advantage is crucial in sectors like energy and chemicals, where brand trust is paramount. SK's existing customer relationships further fortify its position against new entrants.
- SK Inc.'s strong brand perception reduces the threat of new companies.
- High customer loyalty makes it tough for newcomers to gain traction.
- SK Inc. leverages its reputation to maintain a competitive edge.
- Customer relationships strengthen SK Inc.'s market position.
Economies of Scale
Economies of scale pose a significant barrier to entry, benefiting established companies. SK Inc., for instance, leverages its large operational scale to achieve lower per-unit costs, making it difficult for new competitors to match prices. This cost advantage stems from various factors. SK Inc.'s established infrastructure and operations create a substantial hurdle for new entrants.
- SK Inc. operates in multiple sectors including energy and chemicals.
- Economies of scale allow SK Inc. to negotiate better prices.
- SK Inc.’s established brand recognition and customer loyalty further strengthen its position.
- New entrants face high initial investment costs.
Market Entry Challenges: A Look at Barriers
Threat of new entrants is assessed based on various factors. High barriers such as capital needs and regulatory hurdles make it tough for new players to enter a market. Established firms like SK Inc. benefit from these barriers, maintaining market dominance.
| Factor | Impact on New Entrants | 2024 Example |
|---|---|---|
| Capital Requirements | High investment needed | SK Inc.'s energy sector investments totaled billions of dollars. |
| Regulatory Hurdles | Costly and time-consuming | Biopharma sector faces stringent approvals. |
| Brand Loyalty | Difficulty gaining market share | SK Inc. has strong brand recognition in 2024. |
Porter's Five Forces Analysis Data Sources
SK Porter's analysis draws from company financials, industry reports, competitor analysis and market share data to assess each competitive force.
