SK SWOT Analysis
Fully Editable
Tailor To Your Needs In Excel Or Sheets
Professional Design
Trusted, Industry-Standard Templates
Pre-Built
For Quick And Efficient Use
No Expertise Is Needed
Easy To Follow
SK Bundle
What is included in the product
Analyzes SK’s competitive position through key internal and external factors
Facilitates interactive planning with a structured, at-a-glance view.
Same Document Delivered
SK SWOT Analysis
What you see is what you get! This preview reflects the exact SK SWOT analysis document you will receive.
There's no hidden content—the complete, in-depth analysis awaits after purchase.
Expect a fully realized SWOT, meticulously crafted, ready for your strategic needs.
No compromises: the quality and detail remain consistent from preview to download.

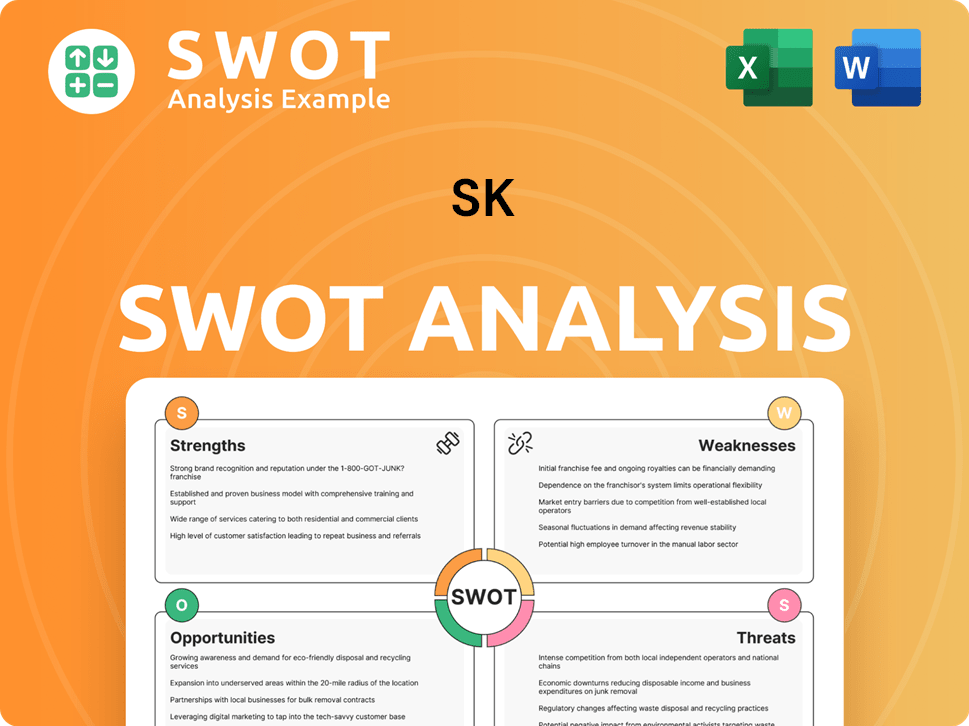
SWOT Analysis Template
Make Insightful Decisions Backed by Expert Research
Our SK SWOT analysis offers a glimpse into the company's key strengths and weaknesses. We've also highlighted potential opportunities and threats, giving you a snapshot. This preview merely scratches the surface of their complex positioning. Purchase the complete SWOT analysis to gain a detailed, research-backed perspective, helping you formulate effective strategies, backed by actionable insights and a comprehensive assessment.
Strengths
Diversified Business Portfolio
SK Inc. boasts a diversified portfolio spanning energy, chemicals, IT, and biopharmaceuticals, offering resilience against industry-specific downturns. This broad scope helps to stabilize growth, a crucial factor in today's volatile markets. In 2024, SK's diverse holdings contributed to a 5% increase in overall revenue. The company's strategic approach fosters potential synergies across its various segments.
Strong Position in Key Industries
SK Group's strengths include strong footholds in key industries. SK Hynix is a prominent force in the semiconductor memory market, especially in high-bandwidth memory (HBM) for AI applications. The merger of SK Innovation and SK E&S formed a significant private energy company in the Asia-Pacific region. In 2024, SK Hynix's revenue was approximately $32 billion, showcasing its market dominance.

Focus on Future Growth Engines
SK Inc.'s strategic focus on future growth engines, including AI, biopharmaceuticals, and green energy, is a key strength. The company's 'New SK' vision underscores its commitment to an AI-driven transformation, aiming to lead in innovative sectors. SK's investments in these areas align with emerging market trends. In 2024, SK Hynix invested heavily in AI-related infrastructure.
Commitment to Innovation and R&D
SK Inc. and its subsidiaries are deeply committed to innovation and R&D, especially in semiconductors and biopharmaceuticals. SK hynix leads with AI memory products, while SK Biopharmaceuticals invests in new drug discovery. This dedication fuels their competitive edge in fast-evolving markets. SK Group invested over 19 trillion KRW in R&D in 2023.
- SK hynix's record AI memory products drive innovation.
- SK Biopharmaceuticals' investment in drug discovery platforms.
- SK Group's R&D spending of over 19 trillion KRW in 2023.
Strategic Partnerships and Global Expansion
SK Group's strategic partnerships and global expansion are key strengths. SK Biopharmaceuticals has partnered for global sales, with revenues expected to reach $1 billion by 2025. SK Telecom plans significant investments in global AI infrastructure, allocating $2 billion for expansion by 2026. These moves boost market reach and diversify revenue streams.
- SK Biopharmaceuticals' partnerships drive global sales of epilepsy treatment.
- SK Telecom invests billions in global AI infrastructure.
- Expansion increases market reach and revenue diversification.
- Expected revenue of $1B by 2025 for epilepsy treatment.
SK Inc.: Solid Growth and Strategic Moves
SK Inc. leverages a diversified portfolio for stable growth and synergy across segments, exemplified by a 5% revenue increase in 2024.
Strong market positions, particularly in semiconductors and energy, highlight SK's prowess; SK Hynix's 2024 revenue was roughly $32 billion.
The company's emphasis on future growth areas such as AI and green energy demonstrates foresight and adaptability. Strategic partnerships are key for expansion and market penetration.
Robust R&D spending, with over 19 trillion KRW invested in 2023, fuels innovation, giving a competitive edge. SK Biopharmaceuticals anticipates $1 billion revenue by 2025 due to global sales partnerships.
| Feature | Details | Financial Data (2024) |
|---|---|---|
| Revenue Growth | Overall revenue | +5% |
| SK Hynix Revenue | Semiconductor market | $32 billion |
| R&D Investment (2023) | Total investment | Over 19 trillion KRW |
| Expected Revenue (2025) | SK Biopharmaceuticals | $1 billion |
Weaknesses
High Debt Levels
SK Group faces high debt levels, potentially limiting its financial agility. Its substantial leverage could restrict future investments. Despite asset sales aimed at reducing debt, the high leverage is a continuing concern. As of late 2024, SK Group's debt-to-equity ratio stood at 200%, a signal of the company's financial risk.
Exposure to Cyclical Industries
SK Inc.'s reliance on cyclical industries presents a weakness. The refining and chemicals sectors are highly sensitive to economic cycles. For example, in 2024, global chemical sales are projected at $5.7 trillion. This volatility can significantly impact earnings.

Integration Challenges from Mergers and Acquisitions
SK's recent history involves major restructuring through mergers and acquisitions. These changes, including asset sales, introduce integration hurdles. Successfully merging operations, cultures, and systems is often complex. Operational and organizational challenges can arise from these transitions.
Execution Risk in New Growth Areas
SK faces execution risks in new growth areas like biopharmaceuticals and green energy. These ventures demand successful R&D, strategic market entry, and adept navigation of regulations. For instance, the biopharmaceutical sector's high failure rates and long development cycles pose significant challenges. A 2024 study showed a 90% failure rate for drugs entering clinical trials. These areas have complex regulatory hurdles.
- R&D failures can be costly, potentially impacting SK's financial performance.
- Market adoption rates are uncertain, affecting revenue projections.
- Regulatory changes can delay or halt projects, increasing risk.
Competition in Key Markets
SK Inc. faces fierce competition across its diverse business sectors. This intense rivalry pressures margins and demands constant innovation to stay ahead. For example, the global semiconductor market, crucial for SK Hynix, is dominated by giants like Samsung and Intel. Competition is also evident in the renewable energy sector, where SK E&S competes with numerous international players.
- SK Hynix's Q1 2024 revenue increased, but faces margin pressure from rivals.
- The global battery market is projected to reach $559.8 billion by 2030, intensifying competition.
- SK E&S competes in a renewable energy market expected to grow, but faces established players.
SK Group: High Debt and Execution Risks Loom
SK Group's high debt levels could constrain future investments and heighten financial risks, evidenced by its 200% debt-to-equity ratio in late 2024. Its reliance on cyclical sectors introduces earnings volatility, such as chemical sales projected at $5.7T in 2024. Integration issues arise from mergers and acquisitions, plus execution risks in growth areas. Fierce competition puts margin pressure.
| Weaknesses | Details | Impact |
|---|---|---|
| High Debt | 200% debt-to-equity (late 2024) | Limits flexibility, restricts investments |
| Cyclical Industries | Chemical sales at $5.7T in 2024 | Earnings volatility |
| M&A Challenges | Restructuring and integration hurdles | Operational and organizational problems |
| Execution Risks | Biopharma/Green Energy - high failure rates | Financial Performance Impact |
Opportunities
Growth in AI and Digital Transformation
The surge in global demand for AI and digital transformation offers SK Inc. substantial growth prospects. SK hynix can capitalize on the AI memory market, while SK Telecom can excel in AI infrastructure and services. SK Inc. has allocated $1.5 billion for AI investments by 2025, indicating a strong commitment. This strategic focus aligns with the projected AI market growth, expected to reach $200 billion by 2025.
Expansion in Biopharmaceuticals
SK Biopharmaceuticals, with its launched product, is expanding globally. The firm actively develops new drugs and considers strategic acquisitions. The global healthcare market, valued at $10 trillion in 2023, presents huge growth opportunities. This growth is projected to reach over $13 trillion by 2028, according to recent forecasts.

Development of Green Energy and ESG Initiatives
SK Inc. can capitalize on the global green energy trend and ESG focus. They're investing in hydrogen, renewables, and carbon capture. SK aims for Net Zero. In 2024, ESG-focused assets hit $40 trillion globally, showing strong growth potential.
Increasing Demand for Advanced Materials
The rise of semiconductors and electric vehicles is boosting the need for advanced materials, a field where SK Inc. has a solid foothold. This presents opportunities for SK to capitalize on its existing capabilities and expand its market share. Investments in cutting-edge materials could unlock significant growth potential. In 2024, the global advanced materials market was valued at approximately $60 billion, with an expected annual growth rate of 8% through 2025.
- Strong market growth in advanced materials.
- SK Inc.'s existing presence in key sectors.
- Potential for expansion through strategic investments.
- Significant market value and growth rate.
Strategic Acquisitions and Partnerships
SK Inc. can seize opportunities for growth through strategic acquisitions and partnerships, expanding into new markets and acquiring cutting-edge technology. The company has a proven track record of utilizing mergers and acquisitions (M&A) to fuel its expansion. For instance, in 2024, SK hynix acquired a stake in Silicon Frontline Technology for approximately $20 million. These moves enhance competitiveness.
- M&A activity is expected to continue, with SK Inc. allocating significant capital for strategic investments in 2024-2025.
- Partnerships can provide access to specialized expertise and resources, accelerating innovation.
- SK Inc. aims to strengthen its global footprint through strategic alliances.
AI, Healthcare, and Green Energy: SK's Growth
SK Inc. benefits from AI's soaring demand and digital transformation. They invested $1.5B in AI by 2025. Expansion via mergers/acquisitions bolsters their footprint and tech.
| Opportunities | Details | 2024-2025 Data |
|---|---|---|
| AI & Digital Growth | Capitalize on AI/digital transformation; investments in AI infrastructure and services. | AI market size projected to $200B; allocated $1.5B by 2025. |
| Healthcare Expansion | Global expansion for SK Biopharmaceuticals via new drugs and acquisitions. | Global healthcare market at $10T (2023), growing to over $13T by 2028. |
| Green Energy & ESG | Invest in hydrogen, renewables, carbon capture for Net Zero goals. | ESG-focused assets reached $40T globally in 2024. |
| Advanced Materials | Capitalize on the need for advanced materials in EVs and semiconductors. | Global advanced materials market valued at $60B in 2024, 8% growth through 2025. |
| Strategic Alliances | Expand through acquisitions and partnerships, bolstering global footprint. | SK hynix acquired stake for ~$20M in 2024. M&A capital allocation ongoing. |
Threats
Economic Downturns and Market Volatility
Economic downturns and market volatility pose significant threats to SK Inc. in 2024/2025. Global economic fluctuations can reduce demand, impacting various SK businesses. For instance, the energy and materials sectors, key to SK, are highly cyclical. In 2023, SK Innovation's revenue was $45.8B, sensitive to market shifts.
Intense Competition
SK Inc. contends with fierce competition across its sectors. This includes battling against established giants and emerging challengers both locally and globally. The competitive landscape can squeeze profit margins. For example, in 2024, the global semiconductor market, a key area for SK, saw increased rivalry, impacting pricing strategies.

Regulatory and Geopolitical Risks
Regulatory shifts and geopolitical events present substantial risks to SK Inc. globally. Changes in trade policies, for instance, could disrupt supply chains and increase costs. Geopolitical instability, as seen with recent conflicts, can directly impact investment returns. These factors demand careful monitoring and adaptive strategies.
Technological Disruption
Technological disruption presents a significant threat to SK Inc. if it lags behind. Rapid innovation can quickly render existing technologies and products obsolete. Failure to adapt could erode SK's market share and profitability. The company must invest heavily in R&D and embrace new technologies. For example, SK Hynix's capital expenditures in 2023 were approximately $7.8 billion, reflecting ongoing efforts to stay competitive.
- Risk of obsolescence in semiconductors, IT, and biopharmaceuticals.
- Need for continuous investment in R&D.
- Potential loss of market share to more agile competitors.
- Impact on profitability if unable to innovate.
Supply Chain Disruptions
Supply chain disruptions pose a significant threat to SK Inc., especially given its involvement in semiconductor manufacturing and other material-intensive sectors. Global vulnerabilities can lead to increased costs and production delays. The semiconductor industry, in particular, faces complex supply chains, making it susceptible to disruptions. These disruptions can impact profitability and market share. In 2024, the World Bank projected a 3.2% growth in global trade, highlighting the interconnectedness and potential for disruption.
- Geopolitical tensions can disrupt supply chains.
- Increased raw material costs.
- Logistics bottlenecks affect timely deliveries.
- Dependence on specific suppliers.
SK Inc.'s Challenges: Economic Storms Ahead
SK Inc. faces substantial threats from economic and market volatility, potentially shrinking demand in crucial sectors like energy and materials, where SK Innovation had $45.8B revenue in 2023.
Competition from both established and emerging players is another critical threat, pressuring SK's profit margins across industries.
Supply chain issues and tech disruption risk obsolescence. This necessitates continuous R&D investment. In 2023, SK Hynix's capex was $7.8B, highlighting efforts to remain competitive amidst geopolitical and economic risks.
| Threat | Description | Impact |
|---|---|---|
| Economic Downturn | Global recession impacting demand. | Reduced profitability |
| Market Volatility | Fluctuating prices affecting investments | Uncertainty and financial losses |
| Competitive Pressure | Aggressive rivals in core markets. | Margin erosion and market share decline |
SWOT Analysis Data Sources
The SWOT analysis is crafted from dependable sources: financial reports, market analysis, and expert opinions for insightful assessments.
