TJX Cos Boston Consulting Group Matrix
Fully Editable
Tailor To Your Needs In Excel Or Sheets
Professional Design
Trusted, Industry-Standard Templates
Pre-Built
For Quick And Efficient Use
No Expertise Is Needed
Easy To Follow
TJX Cos Bundle
What is included in the product
Analysis of TJX Cos' business units, identifying investment, hold, or divest strategies.
Printable summary optimized for A4 and mobile PDFs, presenting a concise BCG matrix for easy distribution and review.
Delivered as Shown
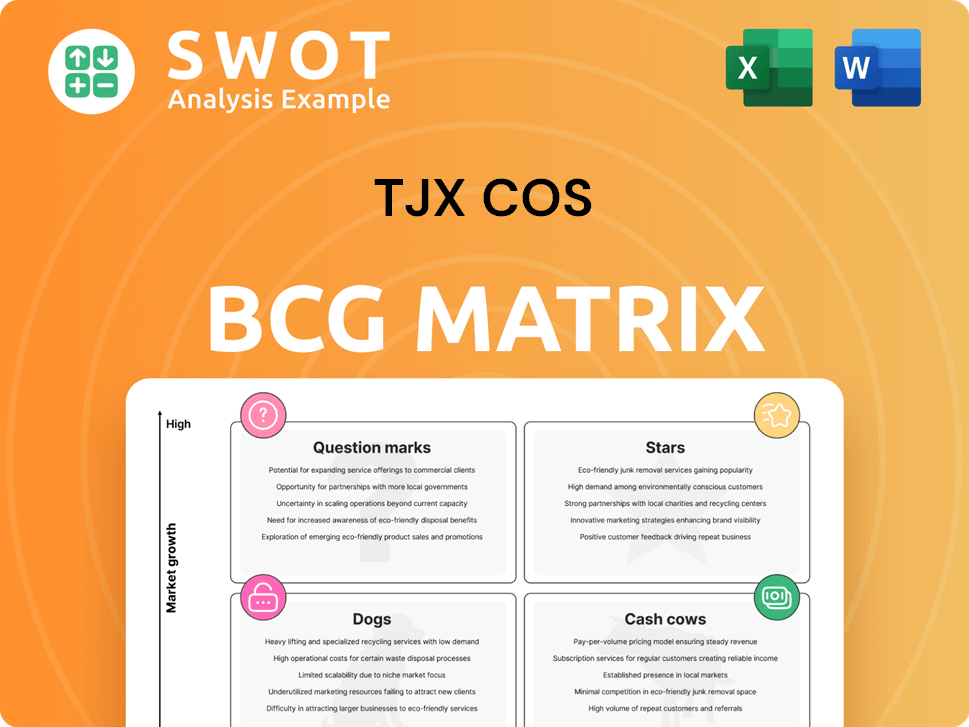
TJX Cos BCG Matrix
The preview shows the complete TJX Cos BCG Matrix you'll get. Instantly download a fully formatted, ready-to-use strategic tool for your analysis.

BCG Matrix Template
Actionable Strategy Starts Here
TJX Cos' BCG Matrix reveals its brand portfolio's strategic positioning. This preview shows how they balance growth, cash generation, and market share. Learn which brands are stars, cash cows, dogs, or question marks for TJX. Gain a clear understanding of their investment focus and market dynamics. Purchase the full version for a complete analysis with actionable insights.
Stars
Marmaxx (TJ Maxx & Marshalls)
Marmaxx, including T.J. Maxx and Marshalls, is a star for TJX. This division, with its strong comparable sales, leads in off-price retail. TJX plans to open 40 net new stores in the US. In 2024, TJX's sales reached $54.2 billion. These stores drive customer transactions.
HomeGoods
HomeGoods shines as a star within TJX's portfolio, fueled by robust growth and expansion. Its increasing sales and expanding store presence solidify its status. HomeGoods has a strong market position, offering attractive merchandise. In 2024, HomeGoods saw a 5% increase in comparable sales.

E-commerce Initiatives
TJX's e-commerce is a star, responding to consumer shifts. They are boosting digital offerings, and streamlining supply chains to sell branded items online. Targeted marketing supports their value, driving online and in-store traffic. In 2024, online sales grew significantly, contributing to overall revenue.
International Expansion
TJX's international expansion is a "Star" in its BCG matrix, fueled by strategic moves like investments in Grupo Axo, Brands for Less. This expansion taps into new markets, diversifying revenue streams. In 2024, TJX saw international sales increase, reflecting the success of its global strategy. Looking ahead, the company plans significant store openings across Europe, Canada, and Australia in 2025.
- International sales growth in 2024.
- Expansion into new markets.
- Planned store openings in 2025.
- Strategic investments.
Opportunistic Buying Strategy
TJX's opportunistic buying strategy shines brightly as a star in its BCG matrix. This approach enables TJX to seize opportunities in the market. They purchase desirable merchandise at reduced costs. This strategy fuels the "treasure hunt" shopping experience. It is a key driver of customer loyalty, which has helped TJX achieve significant financial results. In 2024, TJX's sales increased, reflecting the success of this strategy.
- Flexible buying approach enables TJX to capitalize on inventory imbalances.
- This strategy creates a unique shopping experience.
- It drives repeat visits and fosters customer loyalty.
- TJX's sales increased in 2024, highlighting the strategy's success.
TJX's Stellar Performers: Marmaxx, HomeGoods, and More!
Several facets of TJX shine as "Stars" within its BCG matrix, each propelled by robust growth and strategic initiatives. These include Marmaxx, HomeGoods, e-commerce, and international expansion, all experiencing significant growth. TJX's opportunistic buying strategy further fuels this star status. These segments collectively drove TJX's financial performance in 2024.
| Category | Key Metrics | 2024 Performance |
|---|---|---|
| Overall Sales | Total Revenue | $54.2B |
| Marmaxx | Comparable Sales | Strong growth |
| HomeGoods | Comparable Sales Increase | 5% |
Cash Cows
Existing Store Base
TJX's extensive network of over 5,000 stores positions it as a cash cow, producing steady revenue. In 2024, TJX reported net sales of $54.2 billion, highlighting the strong financial performance of its existing stores. The company's strategy includes relocating about 40 stores and remodeling roughly 500 in 2025 to maintain store appeal. This approach ensures ongoing efficiency and customer engagement.
Strong Brand Recognition
TJX's strong brand recognition, especially for T.J. Maxx and Marshalls, makes it a cash cow. This attracts customers and boosts sales. In fiscal year 2024, TJX reported net sales of $54.2 billion. Its adaptable model helps it stay ahead of trends and maintain customer loyalty, fueling consistent financial results.

Efficient Inventory Management
TJX's strong inventory management solidifies its cash cow status. Fast inventory turnover minimizes excess stock. This aligns procurement with market demand, controlling costs effectively. TJX uses AI for demand forecasting and inventory optimization. In 2024, TJX reported a 3.6 inventory turnover rate, showcasing its efficiency.
Loyal Customer Base
TJX's strong and loyal customer base is a key factor in its "Cash Cow" status. This loyalty translates into steady revenue, supported by the treasure hunt shopping experience and attractive discounts. TJX's focus on customer experience, including AI-driven personalization, boosts satisfaction. This strategy helped drive a 3% increase in comparable store sales in Q3 2024.
- Repeat business fuels consistent sales.
- Discounted prices attract and retain customers.
- AI solutions enhance customer satisfaction.
- Comparable store sales rose 3% in Q3 2024.
Financial Strength
TJX Cos. demonstrates financial strength, acting as a cash cow. The company's robust cash flow supports investments and shareholder returns. In fiscal year 2024, TJX repurchased $2.25 billion of stock and paid $1.1 billion in dividends, reflecting its financial health. This strong financial position offers flexibility for future expansion.
- Strong cash flow generation.
- Shareholder value returned via buybacks and dividends.
- Financial flexibility for expansion.
- Consistent profitability.
TJX: $54.2B in Sales & Thriving Customer Loyalty!
TJX is a cash cow due to its reliable, high-volume sales and customer loyalty. The company's impressive financial results, including $54.2B in net sales in 2024, are a testament to its financial health. TJX strategically reinvests in its stores and operations to stay competitive.
| Key Metric | 2024 Performance | Strategic Implication |
|---|---|---|
| Net Sales | $54.2B | Demonstrates strong revenue generation |
| Inventory Turnover | 3.6 | Highlights efficient inventory management |
| Comparable Store Sales Growth (Q3) | 3% | Indicates customer loyalty and effective strategies |
Dogs
Outdated Store Formats
Outdated TJX store formats, including locations lacking updates, are considered dogs in the BCG matrix. These stores often underperform due to their inability to compete with newer, modernized locations. In 2024, TJX reported a net sales increase of 3% to $13.3 billion. TJX plans to relocate around 40 stores in 2025, potentially closing underperforming ones. This strategic move aims to optimize profitability.
Underperforming Product Categories
Underperforming product categories with low market share are classified as dogs within TJX's BCG Matrix. These categories may need substantial investment for improvement, or they might be discontinued. TJX's adaptable model enables quick reactions to trends and customer preferences. In 2024, TJX reported net sales of $54.2 billion, showcasing its agility.

Regions with Low Market Penetration
Certain regions where TJX has low market penetration can be viewed as dogs in its BCG matrix. These areas might need considerable investment for increased brand awareness. If expansion fails, divestiture could be considered. TJX plans to expand in existing markets and new regions like Spain to boost growth. In 2024, TJX's international sales were $16.8 billion, showing potential for growth in new markets.
Inefficient Supply Chain Links
Inefficient supply chain links within TJX Cos. can be categorized as dogs, demanding substantial investment for enhanced efficiency and cost reduction. These links, if failing to improve, may warrant restructuring. In 2024, TJX invested heavily in technology to bolster customer engagement and sales, strengthening its market position. This strategic move aims to mitigate supply chain inefficiencies.
- Inefficiencies can lead to increased costs and reduced profitability.
- Investments in technology and digital solutions are crucial.
- Restructuring may be necessary for underperforming links.
- TJX's focus is on improving customer experience.
Unsuccessful E-commerce Ventures
Unsuccessful e-commerce ventures with low market share are classified as dogs. These ventures demand substantial investment to boost online presence and customer attraction. TJX is expanding its e-commerce, aiming to improve digital offerings. If these ventures fail, they may be discontinued. In 2024, TJX's online sales represented a significant portion of total sales, reflecting its focus on digital growth.
- E-commerce ventures that haven't gained traction are considered dogs.
- Significant investment may be needed to improve online presence.
- TJX is growing its e-commerce presence to enhance digital offerings.
- Unsuccessful ventures may be discontinued.
TJX's "Dogs": Identifying Areas for Strategic Action
Dogs within TJX's BCG Matrix include outdated store formats. These underperform against modern locations. TJX's 2024 net sales rose 3% to $13.3 billion. Plans involve relocating stores.
Underperforming product categories with low market share also classify as dogs. Substantial investment might be needed. TJX reported $54.2 billion in 2024 net sales. TJX adapts rapidly to trends.
Certain regions with low market penetration are viewed as dogs, possibly needing significant investment. TJX's 2024 international sales reached $16.8 billion. Expansion is planned in existing and new markets.
Inefficient supply chain links within TJX Cos. are also dogs. Restructuring may be needed if issues persist. TJX invested heavily in tech in 2024.
Unsuccessful e-commerce ventures with low market share are considered dogs, needing investment. TJX is expanding e-commerce offerings. 2024 online sales were significant.
| Category | Description | TJX Action |
|---|---|---|
| Outdated Stores | Underperforming, non-updated locations. | Relocation/Closure |
| Underperforming Categories | Low market share, potential for improvement. | Investment/Discontinuation |
| Low Penetration Regions | Need brand awareness & expansion | Expansion or Divestiture |
| Inefficient Supply Chains | Increased costs, decreased profit. | Restructuring, tech investment |
| Unsuccessful E-commerce | Low online presence. | Improve, or Discontinue |
Question Marks
New International Markets (e.g., Spain)
TJX's move into new international markets like Spain is a question mark in its BCG matrix. The company's expansion into Spain by early 2026 under the T.K. Maxx banner presents growth potential, but also challenges. TJX must build brand recognition and compete with established retailers. In 2024, TJX's international segment sales were $17.1 billion, up 8%.
New Store Concepts
New store concepts for TJX, like experimenting with curated brick-and-mortar locations and smaller format stores, fall into the question mark category. These formats aim for high growth but face customer acceptance and financial viability uncertainties. TJX's strategy focuses on smaller retail opportunities, with potential for significant returns. In 2024, TJX opened 18 new stores, including new concepts. This showcases their willingness to innovate.

Emerging Product Categories
TJX's foray into emerging product categories, like beauty and wellness, positions them as a question mark in the BCG matrix. These segments boast high growth potential, appealing to evolving consumer preferences. However, they face the challenge of competing with established brands. For example, the beauty market is expected to reach $580 billion by the end of 2024. Success hinges on effective customer acquisition and market penetration strategies. Herrman's plan to increase beauty product offerings in 2025 reflects this strategic focus.
Investments in Technology
TJX's tech investments, including AI analytics and energy systems, are question marks. These technologies aim to boost efficiency and customer experience, but implementation challenges exist. TJX uses AI to analyze customer data, market trends, and social media. The company's capital expenditures in 2023 were $1.2 billion, reflecting these investments. Success hinges on effective integration and ROI realization.
- AI analytics drive data-driven decisions.
- Energy management systems aim for cost savings.
- Implementation challenges can impact ROI.
- 2023 CapEx of $1.2B shows investment commitment.
Partnerships and Joint Ventures
Partnerships and joint ventures, like the agreement with Grupo AXO in Mexico, are considered question marks in TJX's BCG matrix. These ventures represent potential growth avenues but also pose integration challenges. The strategic move aims to reach new customer segments and boost revenue in a competitive global market.
- Grupo AXO partnership is a strategic move.
- Integration challenges are expected.
- Focus on new customer segments.
- Aim to increase revenue.
Global Retailer's Growth: International Sales Surge to $17.1B
TJX's question marks include international expansions and new store formats. These initiatives, like the Spain entry, aim for high growth but face market and operational uncertainties. In 2024, international segment sales hit $17.1 billion.
| Aspect | Details | 2024 Data |
|---|---|---|
| International Growth | Expansion into new markets | $17.1B segment sales, +8% |
| New Formats | Curated stores and smaller formats | 18 new stores opened, incl. concepts |
| Emerging Categories | Beauty and wellness segments | Beauty market ~$580B (2024 est.) |
BCG Matrix Data Sources
TJX Cos.' BCG Matrix leverages financial statements, industry analysis, and market research for actionable strategic insights.
