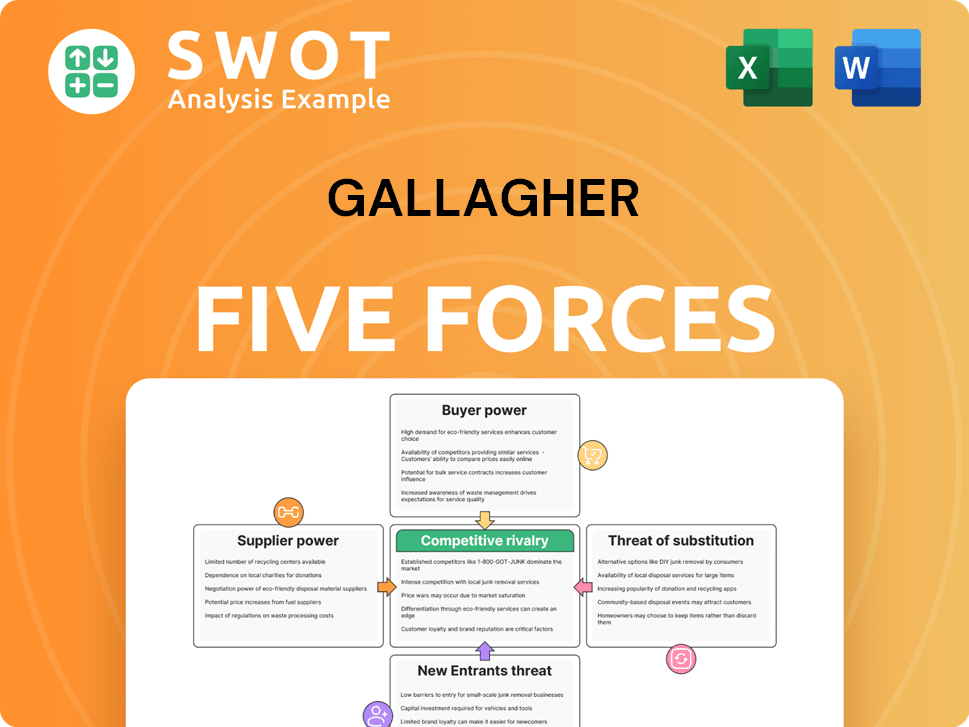
Gallagher Porter's Five Forces Analysis
Fully Editable
Tailor To Your Needs In Excel Or Sheets
Professional Design
Trusted, Industry-Standard Templates
Pre-Built
For Quick And Efficient Use
No Expertise Is Needed
Easy To Follow
Gallagher Bundle
What is included in the product
Tailored exclusively for Gallagher, analyzing its position within its competitive landscape.
Customize pressure levels based on new data or evolving market trends.
What You See Is What You Get
Gallagher Porter's Five Forces Analysis
This preview is the full Gallagher Porter's Five Forces Analysis you'll receive instantly.
The document is identical to what you'll get: detailed, ready-to-use, and professionally formatted.
There are no differences between the preview and the purchased document.
Your download will be the same complete analysis.
Get immediate access to the exact file shown here after buying.

Porter's Five Forces Analysis Template
From Overview to Strategy Blueprint
Gallagher faces a dynamic competitive landscape, shaped by powerful forces. The threat of new entrants, like tech-driven brokers, challenges its market share. Bargaining power of buyers, including large corporations, can influence pricing. Suppliers, especially insurance providers, impact operational costs. Substitute products, such as direct insurance sales, pose a threat. Intense rivalry among existing players, like Marsh & McLennan, demands strategic agility.
Our full Porter's Five Forces report goes deeper—offering a data-driven framework to understand Gallagher's real business risks and market opportunities.
Suppliers Bargaining Power
Limited Supplier Options
In the insurance industry, suppliers, such as reinsurance companies, have substantial bargaining power due to their concentrated nature. The top reinsurance providers manage a large share of the global market, enabling them to influence terms. This concentration allows them to set pricing and conditions. For example, in 2024, the top three reinsurers controlled over 50% of the global reinsurance premiums.
Specialized Tech Dependence
Insurance brokers, like Gallagher, rely heavily on specialized technology for risk assessment and brokerage operations. Key tech providers boast significant market capitalization, indicating their financial strength. This dependence allows these technology suppliers to exert considerable bargaining power. This can lead to increased operational costs for Gallagher, potentially impacting efficiency and profitability.

High Switching Costs
Switching costs in insurance tech are high. Migrating core systems is costly and time-consuming. This difficulty makes switching suppliers hard for Gallagher. For example, in 2024, core system upgrades cost insurers an average of $2 million. This strengthens the tech providers' position.
Data Service Provider Power
In the data service sector, a few major players control the market, influencing pricing. Verisk Analytics, for instance, has a substantial market share. This concentration gives these providers leverage, affecting the costs and terms for Gallagher to get essential data.
- Verisk's revenue in 2023 was approximately $3.06 billion.
- The top 3 data providers control over 60% of the market share.
- Data costs for insurance companies have risen by about 10-15% annually.
- Verisk's stock price increased by nearly 20% in 2024.
Regulatory Influence
Suppliers with specialized regulatory knowledge hold significant power, particularly in the insurance sector. Insurance brokers heavily depend on suppliers who can navigate complex compliance requirements, boosting these suppliers' influence. These compliance solution providers can charge premium prices because their services are essential for brokers to operate legally. This dynamic impacts the cost structure and operational efficiency of insurance businesses.
- In 2024, the global regulatory technology (RegTech) market was valued at approximately $12.3 billion.
- Companies specializing in regulatory compliance solutions experienced a 15% average increase in service fees in 2024.
- The cost of non-compliance fines for insurance brokers rose by 20% in 2024.
- Over 60% of insurance brokers rely on external suppliers for compliance support.
Supplier Power Dynamics: A Deep Dive
Supplier bargaining power significantly affects Gallagher's operations. Reinsurers, holding over 50% of the market share, influence terms and pricing. Technology suppliers, like core system providers, also wield power due to high switching costs. Data and regulatory solution providers further strengthen supplier leverage.
| Supplier Type | Market Share/Control | Impact on Gallagher |
|---|---|---|
| Reinsurers | Top 3 control >50% | Influence pricing, terms |
| Tech Providers | High switching costs | Increased operational costs |
| Data Providers | Top 3 control >60% | Affect costs, terms |
| RegTech | $12.3B market (2024) | Premium prices for compliance |
Customers Bargaining Power
Diverse Client Base
Gallagher's diverse client base, spanning numerous industries and locations, dilutes the bargaining power of customers. This diversification strategy shields Gallagher from the influence of any single client. In 2024, Gallagher's revenue was spread across various sectors, with no single client accounting for a significant portion, ensuring stability. This broad base minimizes vulnerability to customer demands.
Price Sensitivity
Customers in the insurance brokerage market, like those served by Gallagher, show a high degree of price sensitivity. Clients often negotiate prices, with typical negotiation ranges between 5-8%. For example, in 2024, Gallagher's revenue was significantly impacted by pricing strategies. To maintain client retention, Gallagher must balance competitive pricing with high-quality service.

Rebidding Rates
In the insurance brokerage sector, customers wield considerable bargaining power, mainly due to high rebidding rates. Around 27% of insurance contracts are up for rebidding each year. This allows customers to frequently compare prices and terms. This rate gives clients significant leverage to negotiate more favorable terms.
Demand for Digital Services
Clients now heavily lean on digital and data-driven services, changing service delivery. Digital platform use is significant; for example, 70% of clients use digital platforms. Satisfying these expectations is key for retaining clients.
- Client influence grows with digital service demands.
- Digital platforms are crucial for client interaction.
- Client retention depends on meeting digital needs.
- Technology adoption is driven by client demand.
Customized Solutions
The demand for customized risk management solutions is on the rise, significantly boosting client bargaining power. Clients are increasingly requesting tailored services. This trend allows them to negotiate for better terms. This is especially evident in the insurance sector. For instance, in 2024, bespoke insurance policies accounted for 15% of new business deals.
- Custom solutions are up in demand.
- Clients have the power to negotiate.
- Tailored services increase client power.
- Bespoke policies are on the rise.
Gallagher's Client Dynamics: Bargaining Power & Pricing
Customer bargaining power at Gallagher is moderated by its diverse client base, mitigating the impact of any single client's demands. Price sensitivity remains high, influencing Gallagher's pricing strategies, where clients negotiate prices, typically within a 5-8% range. Digital service demands and bespoke solutions are increasing, empowering clients to seek tailored deals, with customized policies making up a significant portion of new business.
| Aspect | Impact | Data (2024) |
|---|---|---|
| Client Diversification | Reduces customer bargaining power | No single client >10% of revenue |
| Price Sensitivity | Negotiations & Impact pricing | Negotiation range: 5-8% |
| Digital Service | Enhances client leverage | 70% clients use digital platforms |
Rivalry Among Competitors
Intense Competition
The insurance brokerage market is fiercely competitive, featuring global giants. Marsh McLennan and Aon are major rivals, controlling substantial market shares. For instance, Marsh McLennan's 2023 revenue was $23 billion. This rivalry compels Gallagher to stand out through unique services and pricing strategies. The competitive landscape demands constant innovation.
Industry Consolidation
The insurance brokerage sector is seeing major consolidation, with mergers and acquisitions driving the formation of larger firms. This rise in consolidation intensifies competition, as Gallagher faces off against these bigger entities. For example, in 2023, there were several significant acquisitions in the insurance brokerage industry, showing this trend's acceleration. This necessitates Gallagher to employ strategic growth plans to stay competitive.

Technology Investments
Firms are pouring money into tech and digital shifts. In 2024, tech spending rose significantly. This includes AI and platform development, with investments growing by double digits annually. Gallagher needs to match this to stay ahead. Staying current with tech is crucial for competitiveness.
Differentiation Strategies
Differentiation is key in competitive rivalry. Gallagher must leverage specialized industry expertise. Firms with niche skills and global reach have an edge. This focus helps Gallagher stand out. It's crucial for long-term success.
- Specialized knowledge boosts competitive advantage.
- Global presence expands market reach.
- Focus on these areas to differentiate.
- Differentiation strategies increase market share.
Client Retention
Maintaining high client retention rates is crucial for Gallagher Porter in this competitive landscape. The average client retention rate serves as a critical marker of their competitive standing. To preserve its market position, Gallagher must emphasize client satisfaction and relationship management. In 2024, the insurance brokerage industry saw varying retention rates. Gallagher needs to focus on these aspects to succeed.
- Industry average client retention rates fluctuate, with some firms achieving over 90%.
- Gallagher's success hinges on exceeding the industry average for client retention.
- Client satisfaction surveys and feedback mechanisms are vital for improvement.
- Strong relationships often lead to long-term client loyalty and retention.
Insurance Brokerage: A Competitive Landscape
The insurance brokerage market is intensely competitive. Firms compete on service, price, and innovation, like Marsh McLennan, which made $23B in revenue in 2023. Technological advancements and digital shifts also intensify the competition. Differentiation through expertise and client retention are key.
| Key Competitive Factors | Impact on Gallagher | 2024 Market Data |
|---|---|---|
| Market Consolidation | Increased competition from larger firms | Several mergers/acquisitions occurred, intensifying the competition. |
| Technological Investments | Need to match tech spending | Tech spending in insurance rose significantly, about 15%. |
| Differentiation Strategies | Focus on expertise and niche services | Firms with niche skills and global reach hold an edge. |
SSubstitutes Threaten
Digital Insurance Platforms
Digital insurance platforms and Insurtech pose a substitution threat to Gallagher. Investments in Insurtech hit record levels in 2024, signaling significant market disruption. Gallagher must embrace digital transformation to stay competitive, as digital platforms offer alternative insurance solutions. Adapting to these trends is crucial to counter the rising threat.
Direct Insurance
The direct purchase of insurance policies is a growing threat. Customers increasingly buy insurance online. In 2024, direct sales accounted for a significant market share. Gallagher needs robust digital platforms. Failure to adapt could impact market position.

Alternative Risk Transfer
Alternative risk transfer (ART) methods, such as captive insurance, are becoming increasingly popular, presenting a threat to traditional insurance brokers. The captive insurance market was valued at $75.1 billion in 2023. To stay competitive, Gallagher needs to provide a wide range of solutions. This is crucial to keep clients from exploring ART options.
Peer-to-Peer Insurance
Peer-to-peer (P2P) insurance presents a growing threat to traditional insurers like Gallagher as a substitute. The P2P insurance market is expanding; for instance, in 2024, the global P2P insurance market was valued at $6.8 billion. This growth indicates a shift toward community-driven risk sharing, driven by tech-savvy consumers. Gallagher needs to innovate and differentiate its offerings to compete with these emerging alternative insurance models effectively.
- Market Growth: The global P2P insurance market was valued at $6.8 billion in 2024.
- Consumer Preference: There is a growing preference for community-driven risk-sharing models.
- Innovation: Gallagher must innovate to stay competitive.
Insurtech Innovation
Insurtech firms pose a significant threat to traditional insurance brokers like Gallagher. These companies, such as Lemonade and Root, are rapidly growing and attracting customers with their tech-focused models. Insurtechs are capturing market share, with the global insurtech market valued at $5.6 billion in 2023. Gallagher must adopt technology to improve customer experience and stay competitive.
- Insurtech market expected to reach $60 billion by 2030.
- Lemonade's gross earned premium increased by 21% in 2024.
- Root's total revenue was $168 million in 2024.
- Gallagher's revenue was $9.6 billion in 2023.
Gallagher Faces Disruptive Insurance Rivals
The rise of alternative insurance models threatens Gallagher's market position. Insurtech firms, like Lemonade, are growing rapidly, with the insurtech market reaching $5.6 billion in 2023. P2P insurance is also expanding, valued at $6.8 billion in 2024, as customers seek community-driven risk-sharing. Gallagher must innovate to counter these emerging alternatives.
| Substitute | Market Size (2024) | Impact on Gallagher |
|---|---|---|
| Insurtech | $5.6 Billion (2023) | Challenges traditional brokers. |
| P2P Insurance | $6.8 Billion | Competes through community models. |
| Digital Platforms | Growing market share | Requires digital adaptation. |
Entrants Threaten
High Regulatory Hurdles
The insurance industry faces high regulatory hurdles, a major barrier for new entrants. Companies must comply with complex regulations, increasing startup costs. These rules, like those from the NAIC, protect existing firms. In 2024, compliance costs rose 7%, deterring new competition and safeguarding Gallagher's market position.
Capital Requirements
Entering the insurance market demands considerable upfront capital. New firms face substantial costs to comply with regulations and set up shop. For example, in 2024, the initial capital needed could range from millions to billions, depending on the market and scope of operations. These high capital needs act as a barrier, reducing the pool of potential new rivals. This financial hurdle significantly restricts the number of new competitors that can realistically enter the field.

Established Brand Presence
Established insurance brokers like Gallagher benefit from strong brand recognition and long-standing client relationships. These firms have cultivated trust and loyalty over decades. New entrants find it challenging to compete against such a well-established presence. In 2024, Gallagher's revenue reached $9.2 billion, showing their market dominance. This financial strength reflects their ability to retain clients and fend off new competition.
Economies of Scale
Existing firms benefit from economies of scale, posing a barrier to new entrants. Larger brokerages, such as Fidelity and Charles Schwab, can offer competitive pricing. These firms leverage technology and client volume to reduce per-unit costs. New entrants often struggle to match these cost efficiencies, affecting profitability. The average cost to acquire a new client in the financial services industry is around $500 as of 2024, making it harder for new firms to grow.
- Established firms have lower per-transaction costs.
- New entrants face higher marketing and operational costs.
- Large firms offer broader service ranges, attracting more clients.
- Achieving scale requires significant upfront investments.
Technology and Expertise
The threat of new entrants for Gallagher Porter is significantly influenced by the need for advanced technology and specialized expertise. New competitors face substantial barriers due to the high initial investments required in technology and the challenge of attracting skilled professionals. This demand for technological and intellectual capital creates a significant hurdle for new companies seeking to enter the market. The industry is competitive, with established players holding a strong position.
- High initial costs for technology and skilled labor.
- Significant investment needed to compete effectively.
- Established companies have a competitive edge.
Insurance Industry Entry: A Tough Climb
The insurance industry's barriers to entry are substantial, limiting new competitors. Regulatory compliance and high startup costs deter new firms. Established players like Gallagher benefit from brand recognition and economies of scale, creating a strong defense. The need for advanced technology and specialized expertise adds to these hurdles.
| Barrier | Impact | 2024 Data |
|---|---|---|
| Regulations | High compliance costs | Compliance cost increase: 7% |
| Capital | Substantial upfront investment | Initial capital needed: Millions to Billions |
| Brand/Scale | Established firms' advantage | Gallagher's revenue: $9.2B |
| Technology | Expertise and tech costs | Client acquisition cost: ~$500 |
Porter's Five Forces Analysis Data Sources
This analysis leverages public financial reports, market research, industry surveys, and competitor analysis for insights into market dynamics.
