NRG Energy Porter's Five Forces Analysis
Fully Editable
Tailor To Your Needs In Excel Or Sheets
Professional Design
Trusted, Industry-Standard Templates
Pre-Built
For Quick And Efficient Use
No Expertise Is Needed
Easy To Follow
NRG Energy Bundle
What is included in the product
Evaluates control held by suppliers and buyers, and their influence on pricing and profitability.
Quickly assess competition with color-coded force levels, saving time and clarifying key insights.
What You See Is What You Get
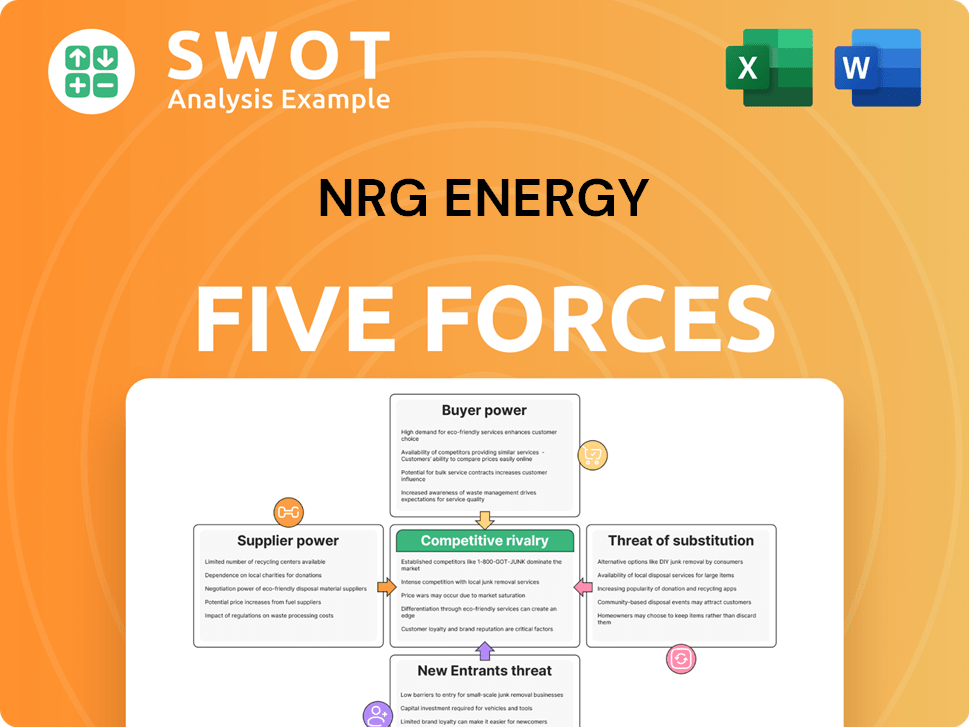
NRG Energy Porter's Five Forces Analysis
This preview details the NRG Energy Porter's Five Forces Analysis you'll receive. It examines competitive rivalry, supplier power, buyer power, threat of substitutes, and threat of new entrants. The document provides a comprehensive strategic assessment of NRG's industry position. You'll get the fully formatted, ready-to-use analysis immediately after purchase. This is the exact document you'll receive.

Porter's Five Forces Analysis Template
A Must-Have Tool for Decision-Makers
Analyzing NRG Energy through Porter's Five Forces reveals a complex competitive landscape. The threat of new entrants is moderate, given high capital costs. Supplier power is significant due to dependence on fuel sources. Buyer power fluctuates based on market dynamics. Substitute products, like renewables, pose a growing threat. Competitive rivalry is intense within the energy sector.
This brief snapshot only scratches the surface. Unlock the full Porter's Five Forces Analysis to explore NRG Energy’s competitive dynamics, market pressures, and strategic advantages in detail.
Suppliers Bargaining Power
Supplier Concentration
NRG Energy faces supplier concentration challenges, primarily due to a limited number of large equipment manufacturers. The company heavily relies on specialized suppliers for power generation infrastructure. This dependence, especially for critical components like turbines, grants suppliers significant pricing power and contract negotiation advantages. For example, in 2024, the top three global turbine manufacturers controlled over 70% of the market share. These suppliers can dictate terms, impacting NRG's profitability.
Fuel Price Volatility
Fuel price volatility significantly affects NRG Energy. Natural gas price swings directly influence generation costs. Dependence on fossil fuels subjects NRG to market instability. Diversified procurement strategies attempt to lessen the risk. In 2024, natural gas prices averaged around $2.50-$3.00 per MMBtu, a key cost driver.

Renewable Energy Equipment Costs
The bargaining power of suppliers significantly impacts NRG Energy's profitability. Costs of solar panels and wind turbines directly affect project economics. For example, in 2024, solar panel prices fluctuated, impacting project budgets. Government incentives and tech advances help offset these costs.
Grid Interconnection
Grid interconnection significantly impacts NRG Energy's operations. Access to transmission infrastructure is crucial for project viability. Limited capacity or high interconnection costs can empower suppliers. These costs can limit NRG's power.
- In 2024, interconnection costs for renewable energy projects averaged $1 million to $3 million per project.
- Transmission constraints in the U.S. led to over $1 billion in curtailment costs for renewable energy in 2023.
- The average wait time for interconnection approval in 2024 was 3-5 years.
Skilled Labor Availability
The availability of skilled labor significantly impacts NRG Energy's operational expenses. Shortages in specialized technicians and engineers can lead to increased labor costs, affecting project timelines and profitability. For example, in 2024, the average salary for a power plant engineer increased by 3%, reflecting the demand for skilled professionals. To mitigate this, NRG Energy can invest in workforce development.
- Power plant engineers' average salary increased by 3% in 2024.
- Investing in training programs can reduce labor costs.
- Shortages can delay project completion.
- Skilled labor availability is critical for operations.
Power Supplier Dynamics Impacting Costs
NRG Energy faces supplier power in equipment and fuel. Limited equipment suppliers, like turbine makers, hold pricing leverage. Fuel price volatility adds to cost uncertainty. Solar and wind equipment costs impact project economics directly.
| Factor | Impact on NRG | 2024 Data |
|---|---|---|
| Turbine Market Share | Higher Costs | Top 3 controlled 70%+ |
| Natural Gas Prices | Cost Volatility | $2.50-$3.00/MMBtu |
| Solar Panel Costs | Project Budget Impacts | Fluctuating prices |
Customers Bargaining Power
Customer Choice in Deregulated Markets
In deregulated markets, customers have considerable bargaining power. Residential and commercial clients can easily switch energy providers. NRG Energy faces this dynamic, as customers can choose among various suppliers. This switching capability limits NRG's ability to raise prices. For instance, in 2024, customer churn rates in competitive energy markets ranged from 10% to 20%, highlighting the ease with which customers can switch.
Price Sensitivity
Customers show high price sensitivity regarding energy. Since power is a commodity, pricing significantly impacts retail decisions. NRG must offer competitive rates to prevent customer defections. In 2024, residential electricity prices averaged around 17 cents/kWh in the U.S., influencing customer choices significantly.

Demand Response Programs
Demand response programs enable customers to cut energy use during peak periods, increasing their bargaining power. This shift allows customers to manage their energy bills more effectively. NRG Energy's programs, like those in Texas, saw participation rates rise, reflecting customer interest in controlling costs. In 2024, these programs helped reduce overall demand during peak hours, giving customers greater leverage.
Aggregation
Customer groups can join forces, enhancing their ability to bargain for more favorable terms. This aggregation bolsters buyer power, which could lead to lower prices for electricity. NRG Energy must provide competitive rates to keep these larger customer groups. These groups, when combined, can represent a significant portion of NRG's revenue.
- Commercial and industrial customers often negotiate directly for better rates.
- Customer aggregation can significantly increase buyer power.
- In 2024, NRG's revenue was about $33 billion.
- Competitive pricing is essential for NRG to retain these large accounts.
Rise of Distributed Generation
The shift towards distributed generation, like rooftop solar, is reshaping the energy landscape. Customers are increasingly adopting on-site generation, decreasing their dependence on established energy suppliers. This transition significantly strengthens their bargaining power. For example, the U.S. residential solar capacity grew by 30% in 2023, reflecting this trend.
- Growing adoption of rooftop solar and distributed energy resources (DERs) is evident.
- This trend reduces customer reliance on traditional energy providers.
- Customers gain increased control over energy costs and supply.
- Increased bargaining power allows for more favorable terms.
Customer Power in Energy Markets
Customers in deregulated energy markets hold considerable bargaining power, able to switch providers easily. Price sensitivity is high; competitive rates are crucial for retention. Demand response programs and distributed generation further empower customers. Customer aggregation and commercial negotiations increase buyer power, affecting NRG Energy's pricing and strategies.
| Factor | Impact on Bargaining Power | 2024 Data/Example |
|---|---|---|
| Switching Costs | Low switching costs empower customers. | Churn rates: 10-20% in competitive markets. |
| Price Sensitivity | High price sensitivity influences choices. | Avg. residential electricity price: ~17 cents/kWh. |
| Demand Response | Customers can manage energy use. | Increased program participation. |
Rivalry Among Competitors
Intense Competition
The deregulated electricity market is fiercely competitive, intensifying rivalry. NRG Energy battles numerous regional and national competitors. In 2024, the industry saw significant price volatility. This includes regulated utilities and independent power producers.
Technological Advancements
Continuous technological advancements are reshaping the power generation landscape. Innovation, such as in solar and wind, intensifies competition. NRG must adopt new technologies to stay competitive. In 2024, solar and wind power saw significant growth, impacting market dynamics.

Pressure to Reduce Carbon Emissions
Competitive rivalry intensifies due to pressure to lower carbon emissions. Emission reduction targets and investments are major competitive drivers. NRG must invest in renewables and carbon reduction tech to stay competitive. In 2024, renewable energy investments reached $366.3 billion globally. This impacts NRG's strategic choices.
Mergers and Acquisitions
Mergers and acquisitions (M&A) continue to reshape the energy sector, intensifying competition. This consolidation, driven by the need for scale and efficiency, directly impacts NRG Energy. Competitors, through M&A, become larger and more formidable. NRG must strategically adapt to this evolving landscape to maintain its market position.
- In 2024, the energy sector saw significant M&A activity, with deals totaling billions of dollars.
- Consolidation often leads to pricing pressures and increased competition for customer acquisition.
- NRG's ability to innovate and integrate new assets is crucial for survival.
Focus on Retail Margins
NRG Energy's emphasis on retail power margins significantly increases competitive rivalry. The retail power sector is incredibly fragmented and fiercely competitive, with numerous players vying for market share. This environment puts constant pressure on NRG to offer competitive pricing and innovative products. Managing retail exposure effectively is crucial for NRG to sustain profitability and navigate the intense competition.
- Retail electricity markets are highly competitive, with numerous providers vying for customers.
- NRG's profitability depends on effectively managing retail margins.
- Competitive pressures necessitate innovative offerings and pricing strategies.
- Market fragmentation leads to intense competition among providers.
Electricity Market: Fierce Competition & Key Trends
Competitive rivalry in the electricity market is intense due to deregulation and numerous players. The sector faces continuous technological advancements, intensifying competition, with solar and wind seeing significant growth. Moreover, pressures to reduce carbon emissions and M&A activities further fuel rivalry. NRG's focus on retail margins adds to this, demanding competitive pricing.
| Aspect | Impact | 2024 Data |
|---|---|---|
| M&A Activity | Increased Competition | Deals totaled billions of dollars. |
| Renewable Energy | Market Transformation | Investments reached $366.3B globally. |
| Retail Margins | Pricing Pressure | High competition among providers. |
SSubstitutes Threaten
Adoption of Rooftop Solar Panels
The adoption of rooftop solar panels poses a threat to NRG Energy. The U.S. residential solar market is expanding; in 2024, it grew by 23% annually. This growth reduces demand for traditional energy sources. NRG must compete with this increasing adoption of distributed generation, impacting its market share.
Distributed Energy Resources
The threat of substitutes for NRG Energy includes distributed energy resources (DERs). Interest in DERs is on the rise, with the global DER market projected to reach $2.8 trillion by 2032. This expansion requires NRG to adapt. In 2024, companies like Tesla and SunPower are major players in this space.

Battery Storage Technologies
Emerging battery storage technologies pose a growing threat. Global battery storage capacity is rising, with a 60% YoY increase in 2024. This enhances energy independence. NRG must adapt its business model, as battery adoption could shift energy consumption patterns, impacting its market share.
Decentralized Power Generation
The threat of substitutes in NRG Energy's market is increasing, primarily due to the shift towards decentralized power generation. This market is experiencing steady growth, with distributed generation capacity in the U.S. reaching approximately 85 GW by the end of 2024. NRG must adapt to this trend, as consumers and businesses increasingly opt for alternative energy sources. This includes solar panels and microgrids.
- Distributed generation capacity in the U.S. reached roughly 85 GW by late 2024.
- Consumers and businesses are exploring alternatives like solar.
- NRG needs to adjust to the decentralized model.
Energy Efficiency Measures
Energy efficiency measures pose a threat to NRG Energy by reducing demand for electricity. Increased efficiency in homes and businesses means less need for power. This directly impacts NRG's sales volume, requiring strategic adjustments. The company must adapt to this evolving landscape to maintain profitability.
- U.S. residential electricity consumption decreased by 0.8% in 2023.
- Energy efficiency investments in the U.S. reached $70 billion in 2023.
- Global demand for energy efficiency is projected to reach $384 billion by 2028.
NRG Faces Growing Competition from Renewables
The threat of substitutes for NRG Energy is intensified by the growth of alternative energy solutions. Distributed generation in the U.S. hit approximately 85 GW by the end of 2024. Consumers and businesses are increasingly turning to alternatives such as solar. NRG must adapt to this shift to maintain its market position.
| Substitute | 2024 Data/Trend | Impact on NRG Energy |
|---|---|---|
| Rooftop Solar | 23% annual growth in U.S. residential market | Reduces demand for traditional energy sources. |
| Distributed Energy Resources (DERs) | Global market projected to reach $2.8T by 2032 | Requires adaptation to compete with new players. |
| Battery Storage | 60% YoY increase in global capacity | Shifts energy consumption patterns. |
Entrants Threaten
High Capital Requirements
The energy sector demands substantial upfront capital for power generation, which serves as a significant barrier. Achieving economies of scale is challenging, further complicating market entry. New firms encounter high initial costs, hindering their ability to compete effectively. For example, in 2024, starting a new utility-scale solar project can require hundreds of millions of dollars.
Regulatory Hurdles
Stringent regulations and permitting processes pose a significant threat to new entrants in the energy sector. The industry is heavily regulated, creating substantial barriers, with compliance costs often reaching millions. New companies must navigate complex requirements, like those from the EPA, which can take years and cost a lot. For example, in 2024, the average permitting time for new power plants in the US was over 2 years, significantly delaying market entry.

Access to Transmission Infrastructure
Limited access to transmission infrastructure presents a significant barrier. New power generators must secure access to transmission lines to deliver electricity. Restricted transmission capacity can discourage new entrants from entering the market. In 2024, the average cost to upgrade transmission infrastructure was $1 million per mile, adding a hefty financial hurdle. This high cost and the time it takes to get regulatory approvals can be a deterrent.
Brand Recognition
Established companies like NRG Energy benefit from robust brand recognition, making it difficult for new competitors to gain a foothold. Incumbents often boast strong, long-standing customer relationships, a significant advantage in the retail electricity market. New entrants must invest heavily in marketing and branding efforts to build awareness and trust, a costly undertaking. This is especially true in 2024, where advertising spending hit record levels.
- NRG Energy's brand value is estimated at $6.5 billion.
- Marketing costs for new energy providers can exceed $100 million annually.
- Customer acquisition costs in the retail energy sector average $300 per customer.
- Established brands hold a 60% market share.
Economies of Scale
Existing players in the energy sector, such as NRG Energy, benefit significantly from economies of scale. These advantages stem from their ability to spread costs over a large production volume, making them more efficient. Larger energy companies like NRG Energy can leverage economies of scale to reduce per-unit costs, giving them a competitive edge. New entrants often struggle to match these cost structures, making it difficult to compete on price.
- NRG Energy's large-scale operations allow for lower per-unit costs.
- Economies of scale include bulk purchasing and efficient distribution.
- New entrants face challenges in achieving comparable cost structures.
- Established companies can offer more competitive pricing.
Energy Startup Hurdles: Capital, Rules, and Giants
New entrants in the energy sector face considerable obstacles. High upfront capital requirements and stringent regulations, such as those enforced by the EPA, create substantial barriers. Established companies, like NRG Energy, benefit from economies of scale and strong brand recognition, adding to the challenges.
| Factor | Impact | 2024 Data |
|---|---|---|
| Capital Costs | High initial investments | Utility-scale solar projects: $200M+ |
| Regulations | Compliance burdens | Permitting time: 2+ years |
| Brand Recognition | Competitive Disadvantage | NRG Brand Value: $6.5B |
Porter's Five Forces Analysis Data Sources
The NRG Energy analysis leverages financial reports, industry research, and SEC filings. We also use competitor analyses and market share data.
