Uber SWOT Analysis
Fully Editable
Tailor To Your Needs In Excel Or Sheets
Professional Design
Trusted, Industry-Standard Templates
Pre-Built
For Quick And Efficient Use
No Expertise Is Needed
Easy To Follow
Uber Bundle
What is included in the product
Offers a full breakdown of Uber’s strategic business environment
Streamlines SWOT communication with visual, clean formatting.
Preview Before You Purchase
Uber SWOT Analysis
This is the actual SWOT analysis document you’ll receive upon purchase—no surprises, just professional quality. What you see here is the complete report in a structured format. Gain instant access to all the Uber SWOT insights. Your detailed analysis awaits after checkout.

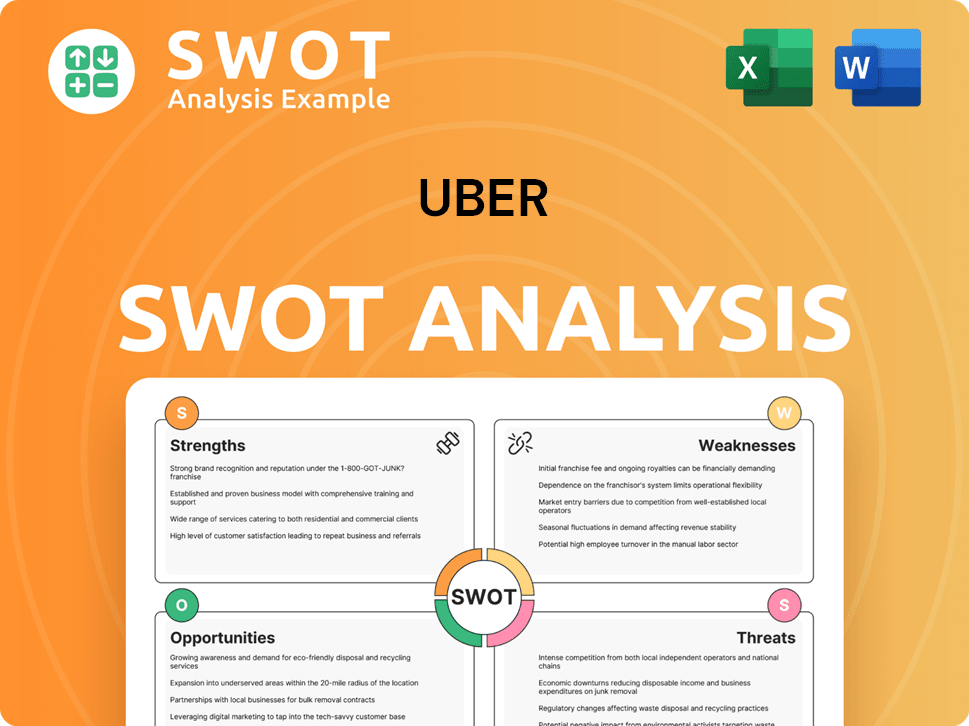
SWOT Analysis Template
Elevate Your Analysis with the Complete SWOT Report
Uber's SWOT analysis unveils strengths like brand recognition and technological prowess. Key weaknesses include profitability challenges and regulatory hurdles. Opportunities involve expansion into new markets and services. Threats encompass competition and economic downturns. This overview offers a glimpse into Uber's complex landscape. Discover the complete picture behind the company's market position with our full SWOT analysis.
Strengths
Global Brand Recognition and Market Presence
Uber's global brand recognition is a major strength, operating in over 70 countries and 10,000 cities. This widespread presence gives Uber a substantial advantage. Its brand value reached approximately $29.1 billion in 2024. This strong brand equity helps in attracting both customers and drivers, globally.
Diversified Service Portfolio
Uber's diversified service portfolio, including ride-hailing, Uber Eats, and Uber Freight, is a major strength. This variety reduces dependence on one area, boosting resilience. In Q1 2024, Uber Eats revenue was $3.26 billion, showing strong diversification benefits. This spread allows Uber to capture different market segments. This strategy supports sustainable revenue growth and market stability.

Robust Technology Platform and Data Analytics
Uber's technology platform is a key strength, offering a seamless user experience. The mobile app simplifies booking, tracking, and payments. Data analytics and AI optimize pricing and routing. In Q1 2024, Uber's mobility revenue was $5.6 billion, showing the platform's efficiency.
Economies of Scale and Network Effects
Uber's vast user base and expansive network of drivers and merchants establish strong network effects. As more people use Uber, more drivers and merchants are drawn in, increasing its appeal and market share. These effects drive operational efficiencies, solidifying Uber's dominance. In Q1 2024, Uber's active users reached 150 million globally.
- Network effects enhance market dominance.
- Operational efficiencies are achieved.
- User base expansion attracts more drivers.
- Q1 2024: 150M active users.
Financial Performance and Growth Momentum
Uber's financial prowess shines through, showcasing robust revenue growth and enhanced financial performance. Gross bookings have surged significantly, alongside improvements in adjusted EBITDA. The company's capacity to generate substantial free cash flow fuels strategic investments and shareholder returns.
- In Q1 2024, Uber's revenue reached $10.1 billion, a 15% increase year-over-year.
- Adjusted EBITDA for Q1 2024 was $1.4 billion, up from $860 million the previous year.
- Free cash flow for Q1 2024 was $1.6 billion, demonstrating strong financial health.
Uber's Dominance: Brand Value, Revenue, and User Base
Uber benefits from its extensive network effects, market dominance, and operational efficiencies. Its robust user base and the appeal to drivers significantly contribute to its market position. Uber’s financial performance underscores strong revenue and profitability.
| Strength | Details | Data |
|---|---|---|
| Global Brand Recognition | Wide market presence, brand value | $29.1B brand value (2024) |
| Diversified Service Portfolio | Ride-hailing, Uber Eats, Uber Freight | Uber Eats revenue $3.26B (Q1 2024) |
| Technology Platform | Seamless user experience | Mobility revenue $5.6B (Q1 2024) |
| Vast User Base & Network | Active users, drivers & merchants | 150M active users (Q1 2024) |
| Financial Prowess | Revenue growth, EBITDA, cash flow | Revenue: $10.1B (Q1 2024) |
Weaknesses
Inconsistent Profitability
Uber's inconsistent profitability stems from high operating costs, like driver incentives and marketing. These expenses, combined with regulatory compliance, strain its financial performance. For example, in Q4 2023, Uber reported a net loss of $143 million. The competitive market demands substantial investments to retain its market share.
Reliance on Gig Economy Workers
Uber's operational model leans heavily on gig economy workers, specifically independent contractors like drivers and delivery personnel. This dependence consistently exposes Uber to legal and regulatory scrutiny, particularly regarding worker classification. Legal battles and regulatory changes concerning driver status could substantially inflate Uber's operational expenses. For instance, in 2024, Uber faced increased pressure in several states to reclassify drivers as employees, potentially leading to higher labor costs.

Reputation and Ethical Concerns
Uber's reputation has suffered due to scandals, impacting public trust. Controversies include passenger safety and driver treatment. These issues can lead to negative publicity. For instance, in 2023, there were several reports on driver safety. This can influence user and investor confidence. In 2024, Uber is working on improving safety measures to restore trust.
Intense Competition in a Fragmented Market
Uber faces fierce competition in ride-hailing and food delivery. This fragmentation includes Lyft, DoorDash, and Grubhub. Intense competition leads to price wars and reduced profitability. For example, in Q4 2024, Uber's Mobility revenue was $5.9 billion, while Delivery brought in $3.2 billion, highlighting the cost of competition.
- Price Wars: Competition forces lower prices.
- Margin Pressure: Profit margins get squeezed.
- Market Fragmentation: Many competitors exist.
Dependence on External Factors
Uber's weaknesses include its vulnerability to external forces. Economic slowdowns, inflation, and political shifts can significantly impact its financial health. Operational disruptions may arise from natural disasters or political unrest across its varied global markets.
- In Q1 2024, Uber's revenue grew 15% year-over-year, but economic instability in key markets poses risks.
- Regulatory changes, such as those impacting driver classification, also threaten profitability.
- Rising fuel prices and inflation rates in 2024 continue to affect operational costs.
Uber's Challenges: Costs, Risks, and Competition
Uber's Weaknesses highlight inconsistent profitability due to high operational costs, including driver incentives and marketing expenses. Its reliance on gig workers exposes it to legal scrutiny, particularly regarding worker classification. Uber's reputation suffers due to scandals that influence trust and investor confidence. Competitive market forces pressure pricing and profitability.
| Weakness | Impact | Data Point (2024) |
|---|---|---|
| High Operating Costs | Reduced Profitability | Q4 2023 Net Loss: $143M |
| Legal and Regulatory Risks | Increased Expenses | Driver reclassification pressure |
| Reputational Issues | Decreased Trust | Safety and driver treatment reports |
| Competitive Pressure | Margin Squeezing | Mobility ($5.9B), Delivery ($3.2B) revenue in Q4 |
Opportunities
Expansion in Developing Countries
Uber can capitalize on growing internet access and a rising middle class in developing countries. These regions offer vast, largely untapped markets for ride-hailing and delivery services. For example, in 2024, Uber saw a 30% increase in trips in Latin America. This expansion can lead to significant revenue growth and market share gains. Furthermore, Uber can tailor its services to local needs, creating a competitive edge.
Diversification into New Service Offerings
Uber can expand into new services like logistics and healthcare transportation. This strategy leverages existing tech and infrastructure. In Q1 2024, Uber's revenue was $10.14 billion, showcasing growth potential. Diversification could boost profits. Explore on-demand services for further expansion.

Integration of Autonomous Vehicles
Uber's investment in self-driving tech offers major cost savings. Autonomous vehicles could slash driver-related expenses, boosting profits long-term. For example, in 2024, driver payouts accounted for a significant portion of Uber's operational costs. Efficient autonomous fleets can improve service times and availability. This transition presents a key growth area for Uber.
Growth of Delivery Services
Uber Eats can capitalize on the booming demand for delivery services, especially food and groceries. This expansion can substantially boost revenue. The global online food delivery market is projected to reach $242.3 billion in 2024. Uber's focus on delivery aligns well with consumer trends.
- Projected market size for online food delivery in 2024: $242.3 billion.
- Uber Eats' potential revenue growth from expanding delivery services.
Strategic Partnerships and Acquisitions
Strategic partnerships and acquisitions offer Uber avenues for rapid expansion and market penetration. For example, Uber's acquisition of Postmates in 2020 for $2.65 billion broadened its delivery services. In 2024, Uber's strategic alliance with Waymo could bolster its autonomous vehicle initiatives, potentially reducing operational costs. Such moves can quickly integrate new technologies and services, like the integration of autonomous driving, which could significantly boost profitability. These collaborations can rapidly enhance Uber's market presence and technological capabilities.
- Acquisition of Postmates in 2020 for $2.65 billion.
- Strategic alliance with Waymo in 2024 for autonomous vehicle technology.
Expanding Markets and Tech: The Future of Mobility
Uber can exploit growth in developing markets and tailored services. Diversifying into logistics and healthcare offers opportunities to grow revenue, as seen with $10.14B in Q1 2024 revenue. Furthermore, investment in self-driving tech can cut expenses.
| Opportunity | Details | Impact |
|---|---|---|
| Market Expansion | Growth in developing nations and expanding delivery options. | Increased revenue and market share. |
| Service Diversification | Venturing into logistics and healthcare. | Boosted revenue, reflecting trends and consumer demand. |
| Technological Advancement | Investment in autonomous vehicles. | Major cost savings with more efficient fleets, higher profits. |
Threats
Regulatory and Legal Challenges
Uber confronts continuous regulatory and legal hurdles globally, especially concerning driver classification and safety. Recent legal battles and evolving labor laws, such as those in California, are increasing operational expenses. These challenges could lead to higher costs and potential business model shifts. For instance, in 2024, Uber spent billions on legal and regulatory matters, impacting profitability.
Intense Competition
Uber faces fierce competition, especially from well-funded rivals and new entrants. The ride-hailing and delivery sectors have low entry barriers, intensifying the pressure. Competitors can erode Uber's market share using aggressive pricing strategies. For instance, Lyft's Q1 2024 revenue was $1.28 billion, highlighting the competitive landscape.

Economic Uncertainty
Economic uncertainty poses a significant threat to Uber. Downturns and inflation can reduce consumer spending on ride-hailing and food delivery. Rising interest rates could also increase operational costs. For example, in Q1 2024, Uber's revenue growth slowed to 15% due to economic pressures. This could lead to decreased demand and revenue.
Technological Disruptions and Cybersecurity Risks
Uber faces threats from rapid tech changes and cybersecurity risks. New technologies could disrupt its ride-hailing dominance. Cybersecurity threats risk data breaches and financial harm. In 2024, data breaches cost companies an average of $4.45 million globally. Uber's reliance on tech makes it vulnerable.
- Technological advancements could render existing services obsolete.
- Cyberattacks could compromise user data and trust.
- Data breaches can lead to significant financial penalties and reputational damage.
Driver and Customer Retention
Uber faces threats in retaining drivers and customers, crucial for its business model. Competition, offering incentives, and potential dissatisfaction with pay or service quality drive churn rates. High churn impacts Uber's network effect and operational efficiency, affecting profitability. In Q1 2024, Uber's monthly active platform consumers reached 149 million, illustrating the scale of customer base vulnerability.
- Driver turnover rates can be high, with some studies suggesting a significant percentage leaving within a year.
- Customer churn rates are influenced by pricing, service quality, and competitor offerings.
- Retaining both drivers and customers is essential for maintaining the network effect and operational efficiency.
Ride-Hailing Giant's Risks: Legal, Economic, and Tech Hurdles
Uber's Threats encompass regulatory, competitive, and economic risks, as well as technological challenges. Ongoing legal battles and evolving labor laws drive up costs, demonstrated by billions spent on legal matters in 2024. Intense competition and economic downturns further threaten profitability and market share, shown in the slowdown of Q1 2024 revenue growth to 15%. Cybersecurity breaches represent a severe risk, potentially costing millions, affecting Uber's operations and user trust.
| Threat Category | Specific Threat | Impact |
|---|---|---|
| Regulatory & Legal | Driver classification, safety | Increased operational costs, potential business model shifts |
| Competition | Aggressive pricing, new entrants | Erosion of market share and reduced profitability |
| Economic | Downturns, inflation, rising interest rates | Decreased consumer spending and higher operational costs |
SWOT Analysis Data Sources
This SWOT analysis relies on financial reports, market analysis, and expert opinions, providing a data-backed, strategic overview.
